Fig. 7.
Download original image
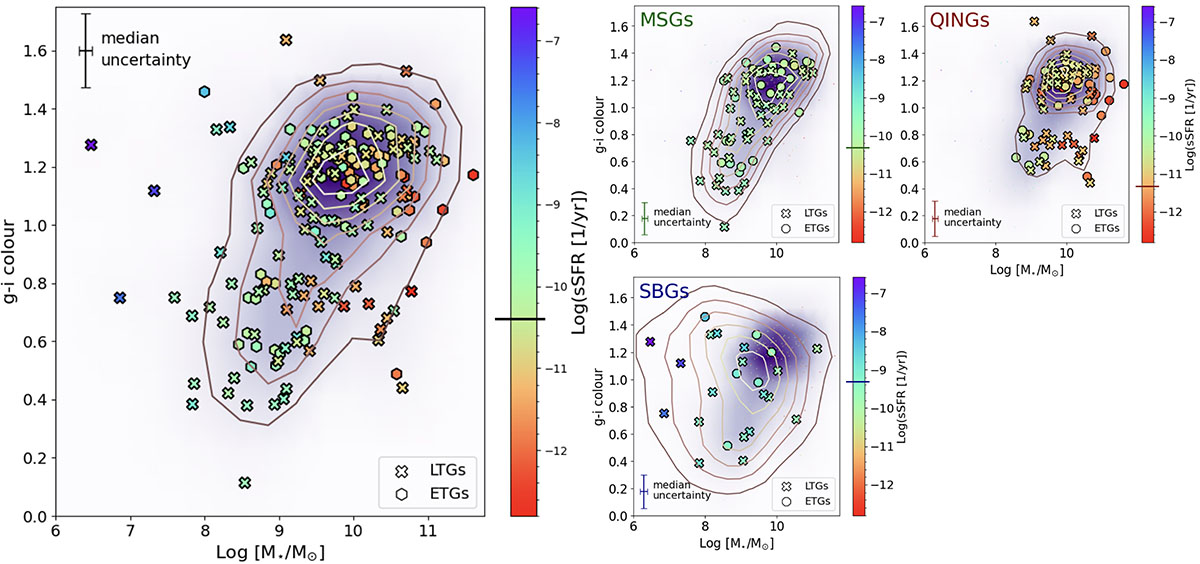
Color mass diagram for the complete sample of HαIR galaxies. SBGs, MSGs and QINGs have been represented independently to the right of the diagram. LTGs are displayed as filled crosses and ETGs as hexagons. The color code is representative of the sSFRHα, and the horizontal line on the colorbar is the median sSFR of the sample. The purple shade follows the density of sources from the complete HαIr sample in every diagram. Contours indicate the density of the sample in each instance. The red sequence, the concentration of galaxies to the top right, is denser than the blue cloud to the bottom left, as would be expected in a galaxy cluster.
Current usage metrics show cumulative count of Article Views (full-text article views including HTML views, PDF and ePub downloads, according to the available data) and Abstracts Views on Vision4Press platform.
Data correspond to usage on the plateform after 2015. The current usage metrics is available 48-96 hours after online publication and is updated daily on week days.
Initial download of the metrics may take a while.