Fig. 8.
Download original image
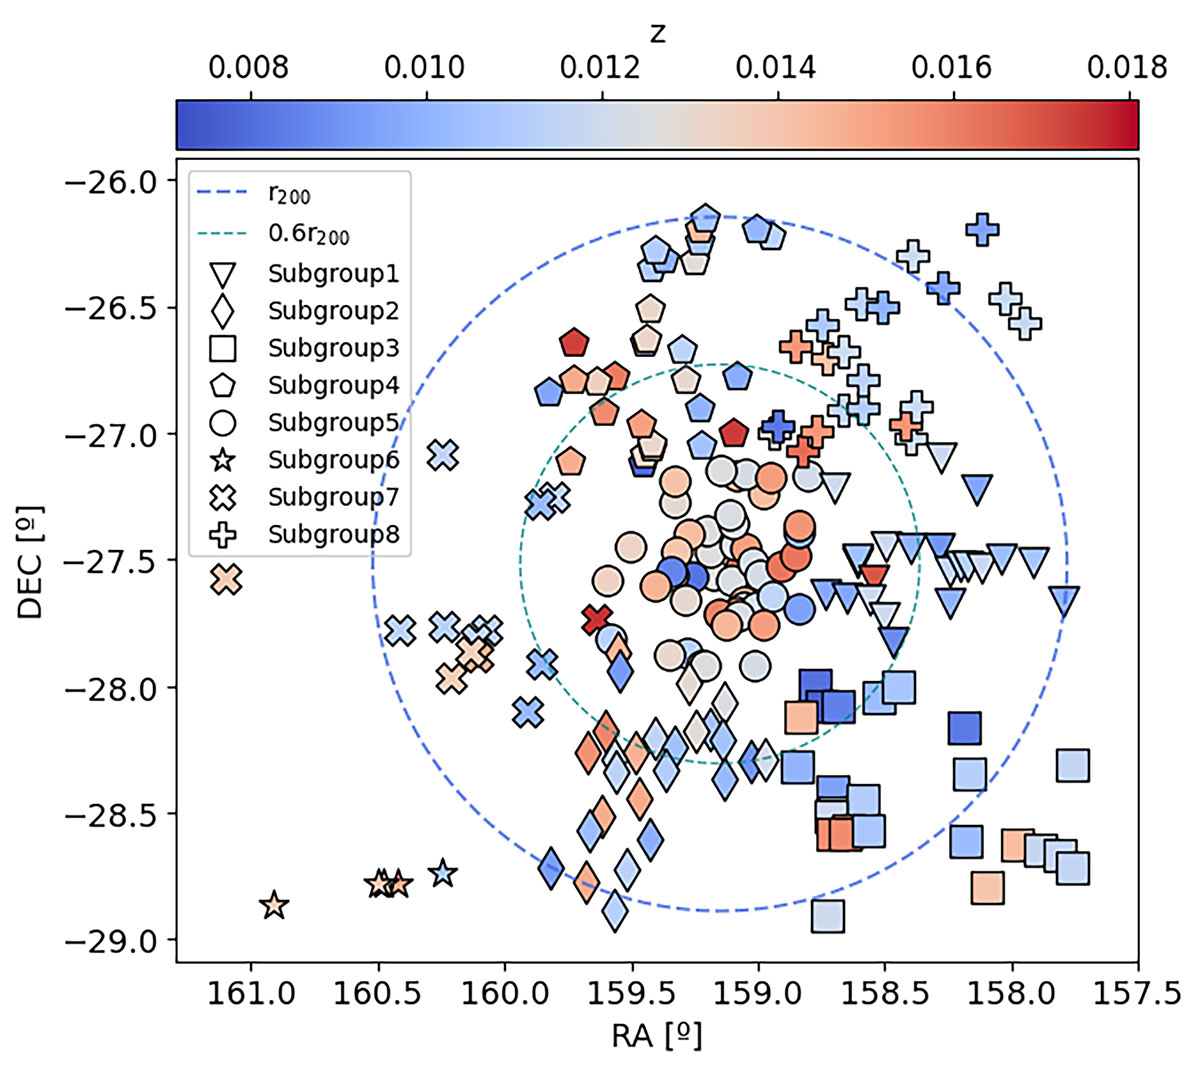
Spatial distribution of the HαIR sample, classified according to spatial distribution as well as redshift (subgroups 1–8) in section 4.5. The colorbar represents redshift: redder markers are more redshifted than bluer ones. The two dashed circles represent the virial radius, and the distance of 0.6r200. We expect an overdensity of galaxies around the latter, given the higher number of galaxies that we can see in this region in Fig. 5.
Current usage metrics show cumulative count of Article Views (full-text article views including HTML views, PDF and ePub downloads, according to the available data) and Abstracts Views on Vision4Press platform.
Data correspond to usage on the plateform after 2015. The current usage metrics is available 48-96 hours after online publication and is updated daily on week days.
Initial download of the metrics may take a while.