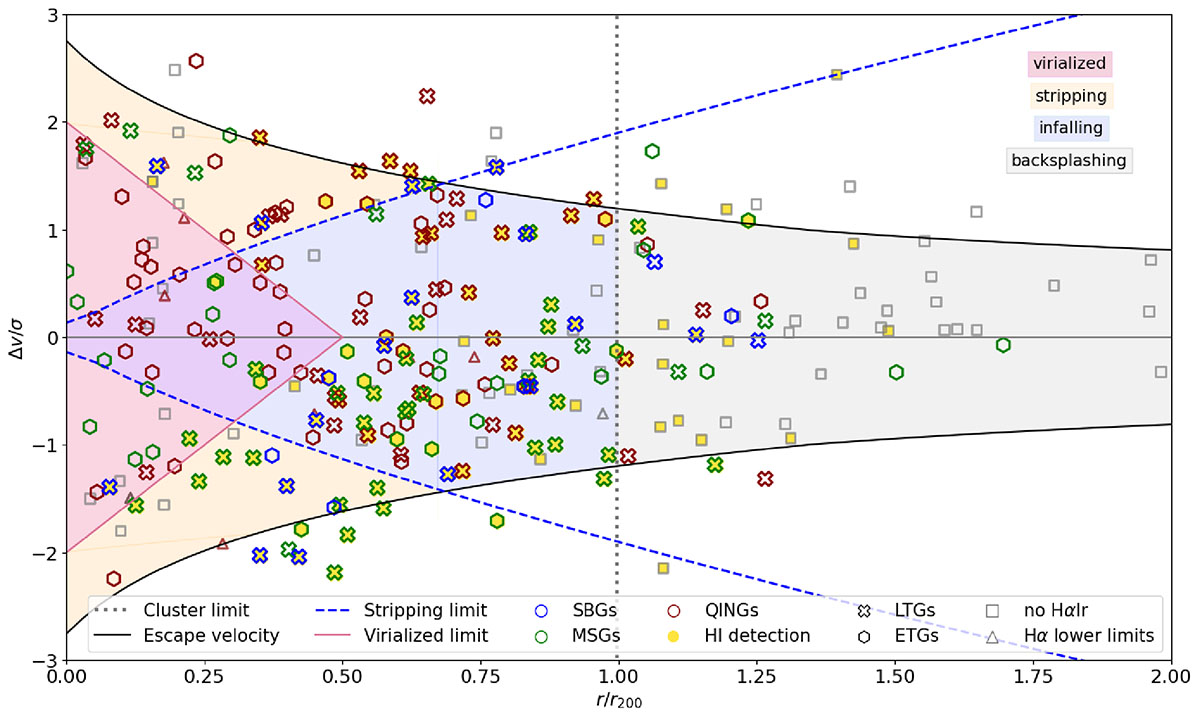
Fig. 9.
Download original image
Projected phase space diagram (PPSD) for SBGs (blue), MSGs (green), QINGs (red), and other Hydra members not in the HαIr sample (gray). Hexagons are early-type galaxies, and crosses are late-type galaxies. Yellow-filled markers indicate HI detections. Black curves delimit the escape velocity region, blue curves represent the stripping limit, and the vertical dashed line is the virial radius. The area within these curves traces four distinct regions: the stripping region (yellow), where galaxies are being heavily stripped of their gas content; the virialized region (red) where virialized galaxies lie; the central infalling region (blue) where galaxies with higher velocity are probably in their initial orbits while the rest are already settled inside the cluster; and the backsplashing region (gray) where galaxies start falling into the cluster or backsplashed.
Current usage metrics show cumulative count of Article Views (full-text article views including HTML views, PDF and ePub downloads, according to the available data) and Abstracts Views on Vision4Press platform.
Data correspond to usage on the plateform after 2015. The current usage metrics is available 48-96 hours after online publication and is updated daily on week days.
Initial download of the metrics may take a while.