Fig. 11
Download original image
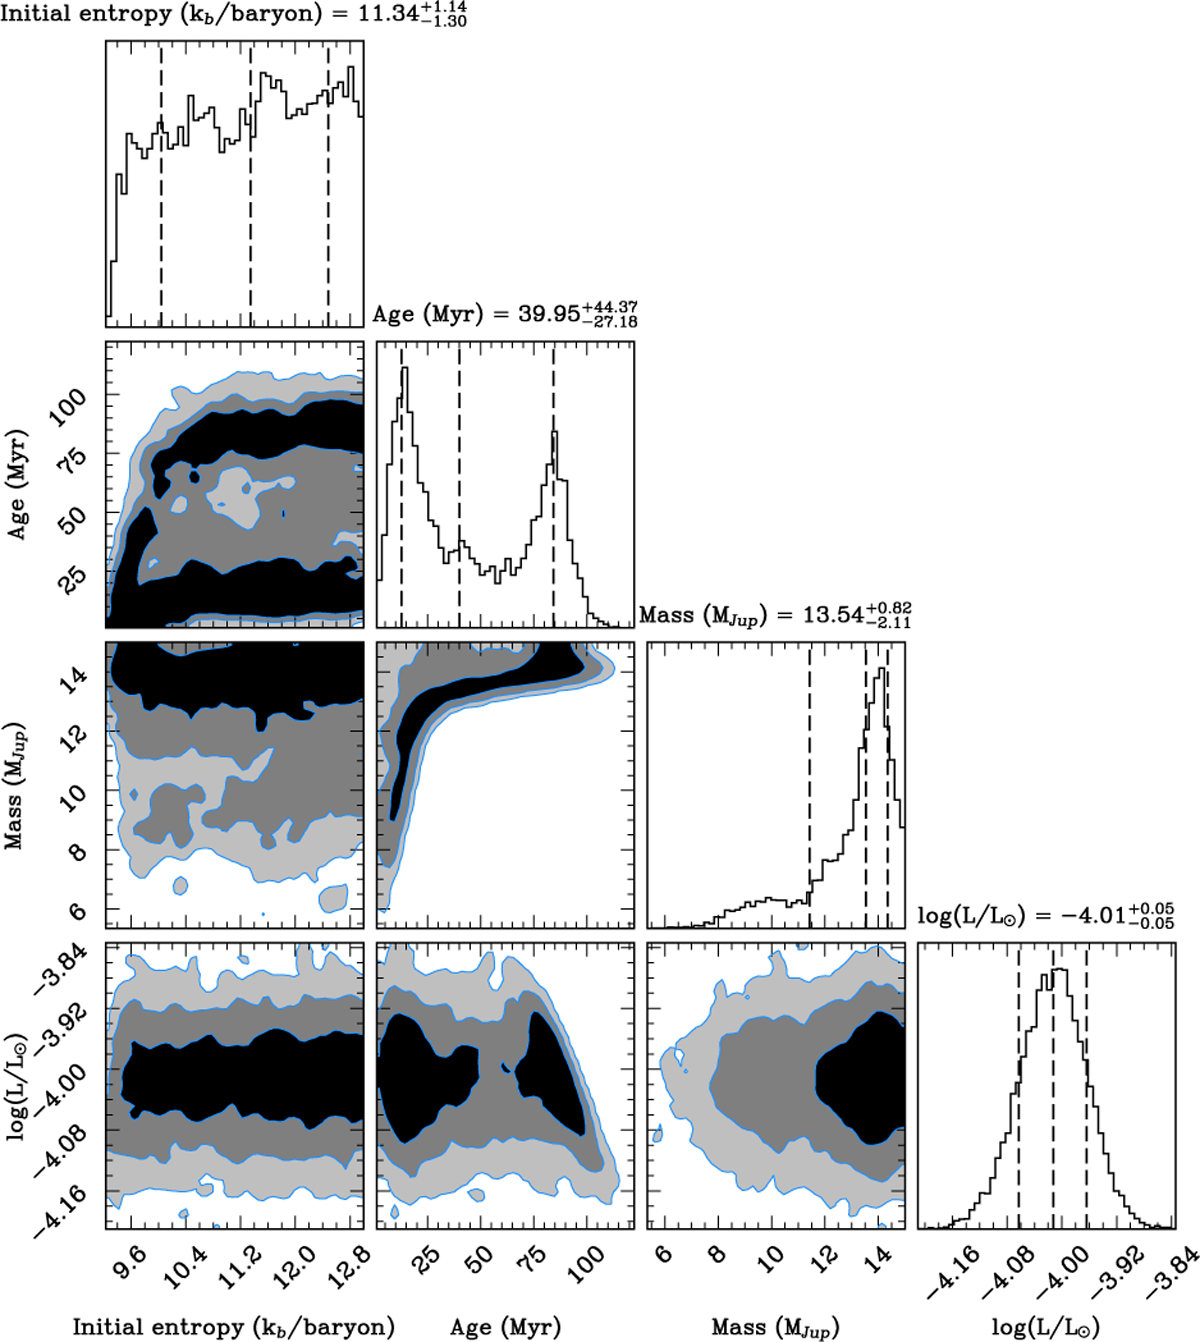
Corner plot illustrating the predictions for initial entropy, age, mass, and bolometric luminosity based on the models from Spiegel&Burrows (2012). The dotted lines indicate the first (16%), second (50%), and third (84%) quantiles. These results were obtained using the method outlined in Zhang (2024), employing the nested sampling approach with 4000 live points.
Current usage metrics show cumulative count of Article Views (full-text article views including HTML views, PDF and ePub downloads, according to the available data) and Abstracts Views on Vision4Press platform.
Data correspond to usage on the plateform after 2015. The current usage metrics is available 48-96 hours after online publication and is updated daily on week days.
Initial download of the metrics may take a while.