Fig. 12
Download original image
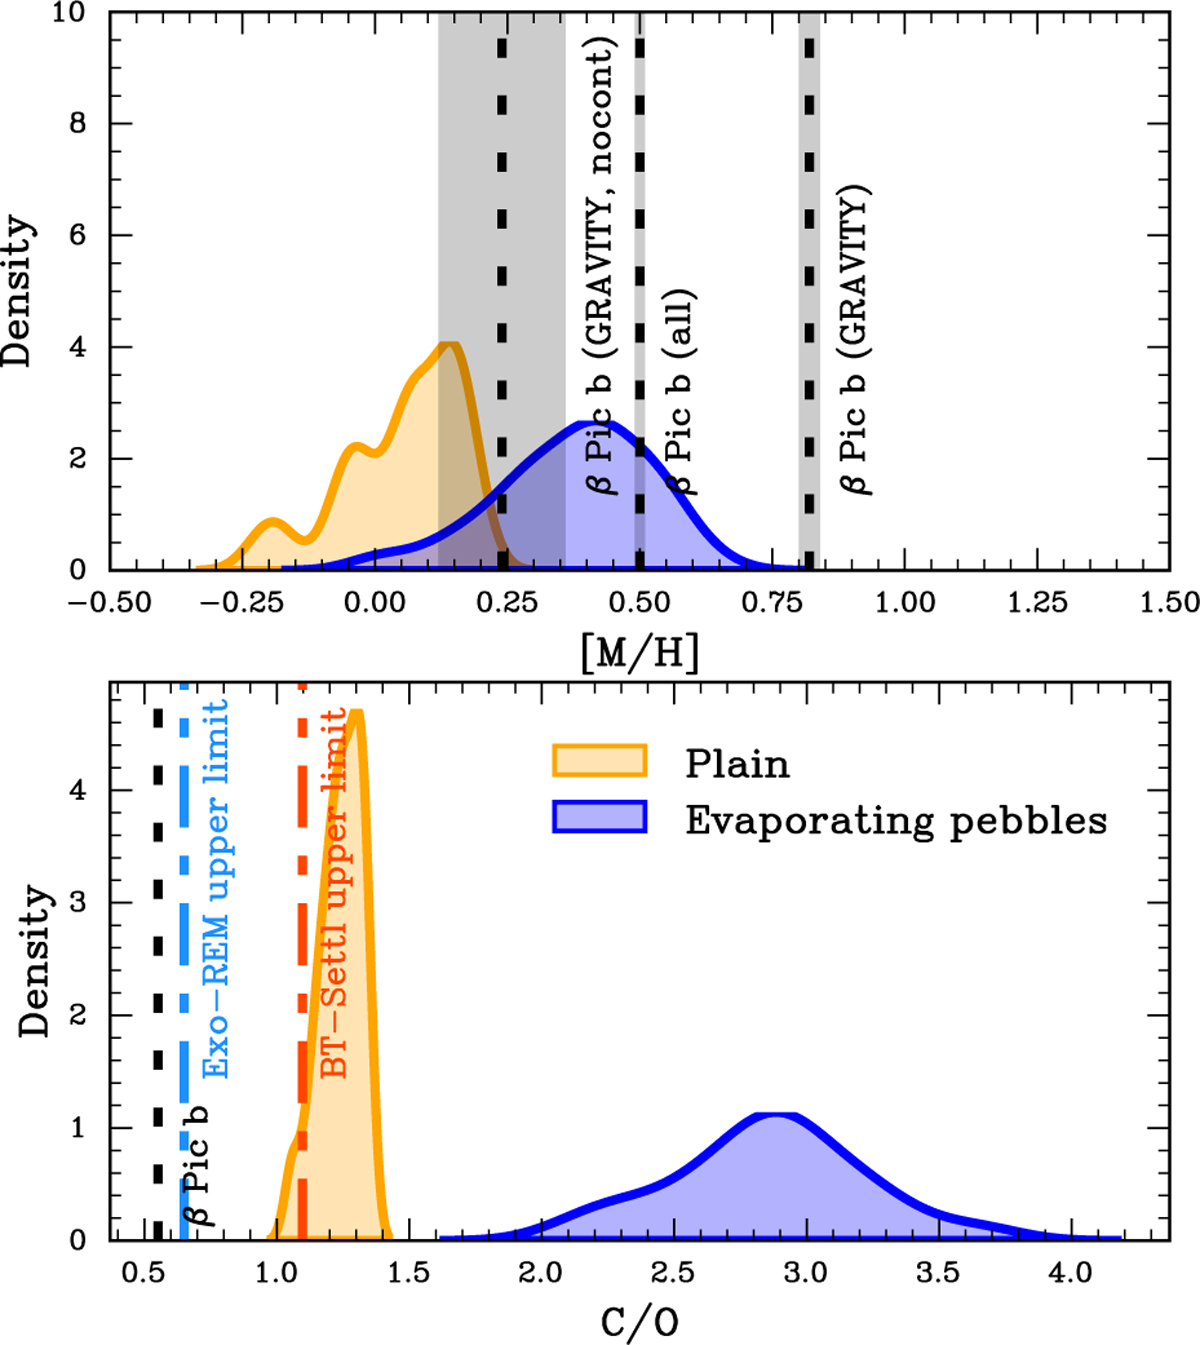
Top panel: Exo-REM [M/H] predictions (dashed black lines) based on three inversions: GRAVITY with continuum (0.82 ± 0.02), GRAVITY without continuum (0.24 ± 0.12), and all datasets combined (0.50 ± 0.01). Colored regions show simulated population predictions from Schneider&Bitsch (2021a) center around the predicted mass (5 MJup ≤ M ≤ 15 MJup) and semi-major axis (5 au ≤ a ≤ 15 au) for β Pic b: in yellow are planets form if the disk is plain (i.e., no evaporation and condensation), while in blue are planets form when the full model is included. Bottom panel: similar to the top panel, but for C/O predictions. All Exo-REM predictions cluster near C/O ∼ 0.55, so only one dashed line is shown. Dashed blue and red lines mark the maximum C/O values explored by Exo-REM and BT-Settl, respectively.
Current usage metrics show cumulative count of Article Views (full-text article views including HTML views, PDF and ePub downloads, according to the available data) and Abstracts Views on Vision4Press platform.
Data correspond to usage on the plateform after 2015. The current usage metrics is available 48-96 hours after online publication and is updated daily on week days.
Initial download of the metrics may take a while.