Fig. 4
Download original image
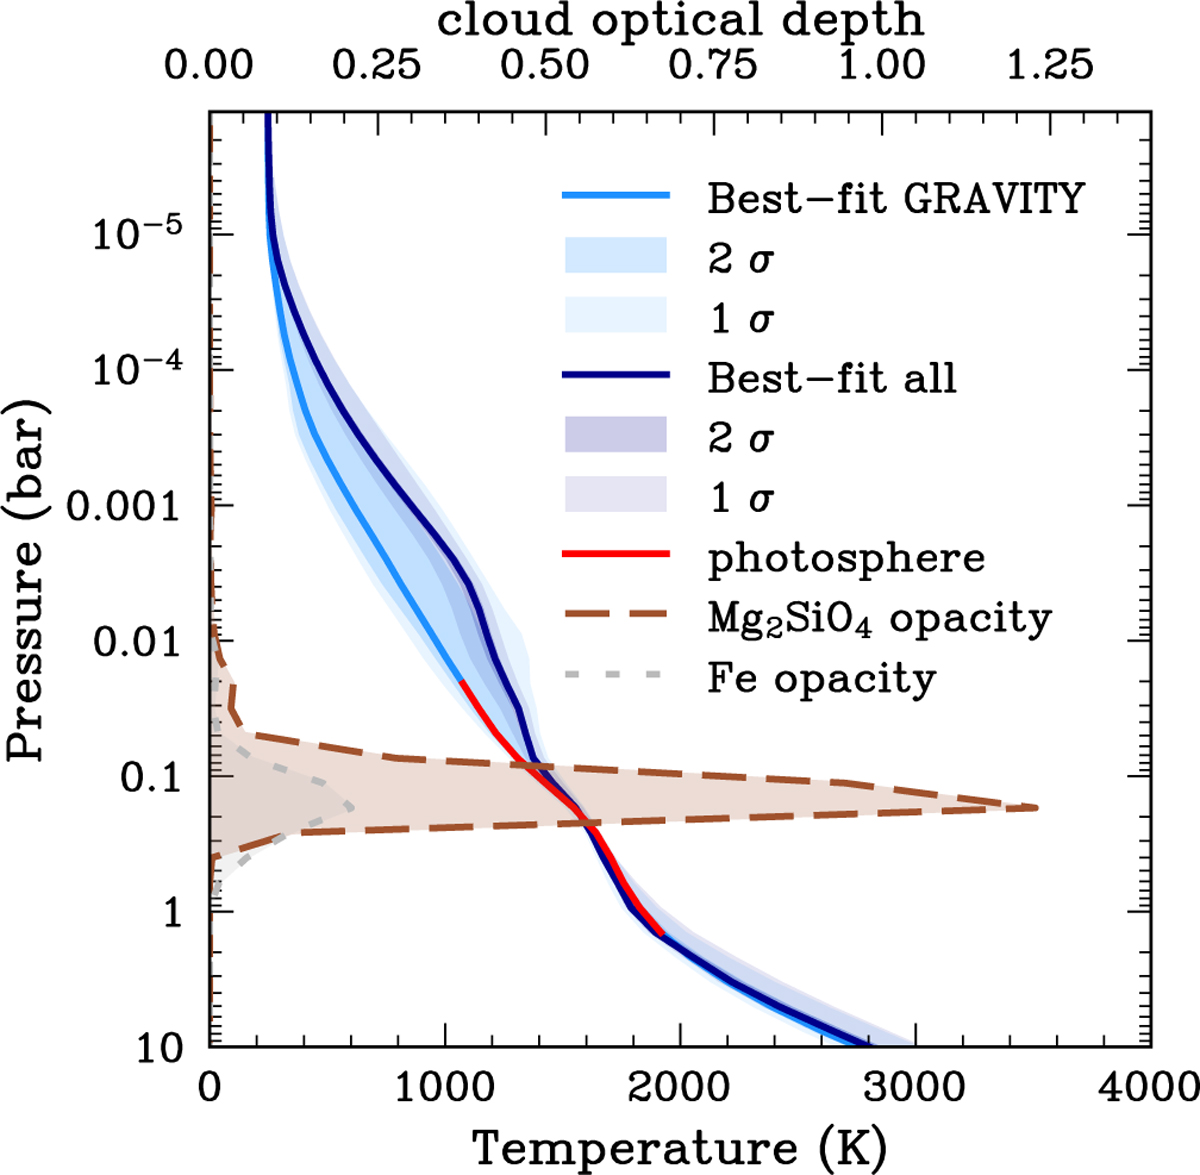
Retrieved best-fit pressure-temperature profiles when using GRAVITY (light blue) and all datasets except CRIRES+ (dark blue) for Exo-REM forward modeling. Shaded regions represent the 1 and 2 σ confidence interval, respectively. They are compared with the cloud optical depths of Mg2SiO4 (dashed brown) and Fe (dashed gray) defined as dτ = σc n dz with σc the effective extinction cross-section of the cloud (in m2), n its concentration (in particles/m3) and dz the thickness of the atmospheric layer (in m). The red curve represents the photosphere (region from which most thermal emission originates). In practice, we used a similar approach as Charnay et al. (2018) and constrained the pressure–temperature between the minimum and maximum of the brightness temperature computed between 0.625 to 10 µm.
Current usage metrics show cumulative count of Article Views (full-text article views including HTML views, PDF and ePub downloads, according to the available data) and Abstracts Views on Vision4Press platform.
Data correspond to usage on the plateform after 2015. The current usage metrics is available 48-96 hours after online publication and is updated daily on week days.
Initial download of the metrics may take a while.