Fig. 5
Download original image
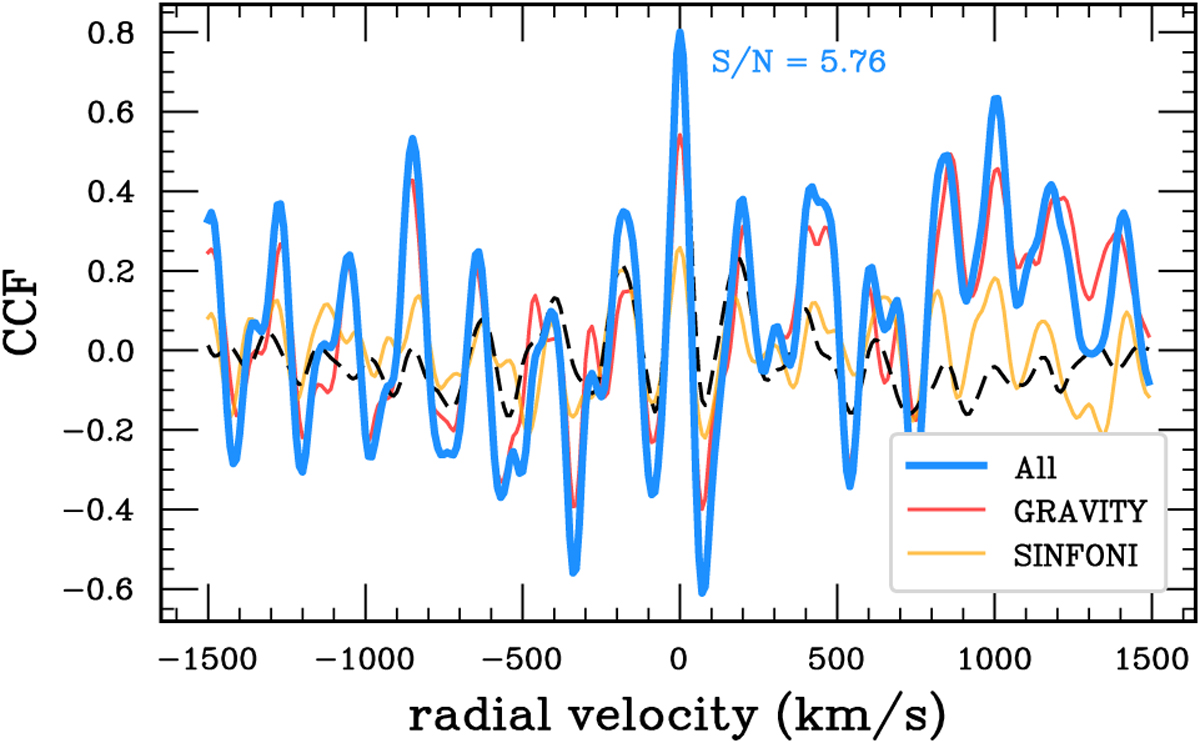
Cross-correlation function (CCF) between the observational residuals (i.e., data minus model without 13CO) and the 13CO model template (i.e., model with 13CO minus model without 13CO) for the two highest resolution data sets (GRAVITY and SINFONI). The sum of all CCFs is shown in blue, while the CCFs for GRAVITY and SINFONI are shown in red and orange, respectively. The auto-correlation function (dashed-black) has been re-normalized to the peak of the CCF. The CCF has been computed between 2.33–2.40 µm with a skipedge of 50 bins to properly cover the two 13CO band heads. The S/N corresponds to that of the central peak and was computed using equation (1) of Houllé et al. (2021) for each individual CCF, then propagated.
Current usage metrics show cumulative count of Article Views (full-text article views including HTML views, PDF and ePub downloads, according to the available data) and Abstracts Views on Vision4Press platform.
Data correspond to usage on the plateform after 2015. The current usage metrics is available 48-96 hours after online publication and is updated daily on week days.
Initial download of the metrics may take a while.