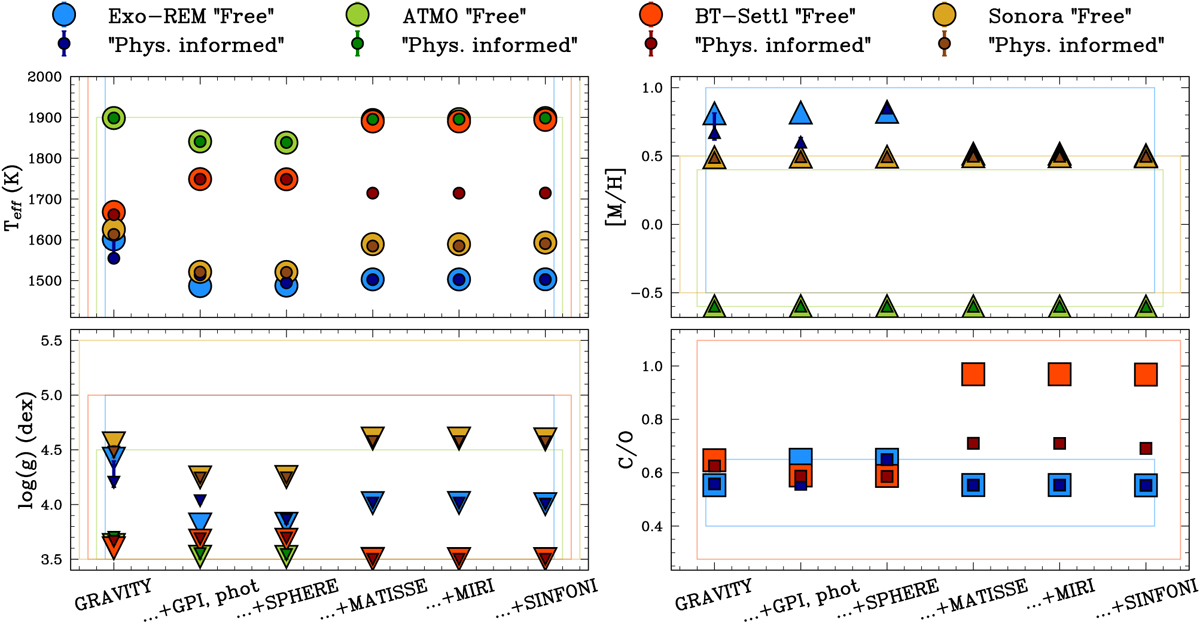
Fig. 6
Download original image
Evolution of the grid parameters when adding observations iteratively from only GRAVITY (left) all except CRIRES+ (right). Each color represents one of the model tested: blue for Exo-REM, green for ATMO, red for BT-Settl and orange for Sonora. Colored boxes indicate the boundaries of the respective model grids. Large markers represent the inversions with the “free” approach, while small markers represent those with the “physically informed” approach. The error bars correspond to the lower and upper bonds in the parameter space encompassing 68% of the retrieved solutions around the best fit.
Current usage metrics show cumulative count of Article Views (full-text article views including HTML views, PDF and ePub downloads, according to the available data) and Abstracts Views on Vision4Press platform.
Data correspond to usage on the plateform after 2015. The current usage metrics is available 48-96 hours after online publication and is updated daily on week days.
Initial download of the metrics may take a while.