Fig. 9
Download original image
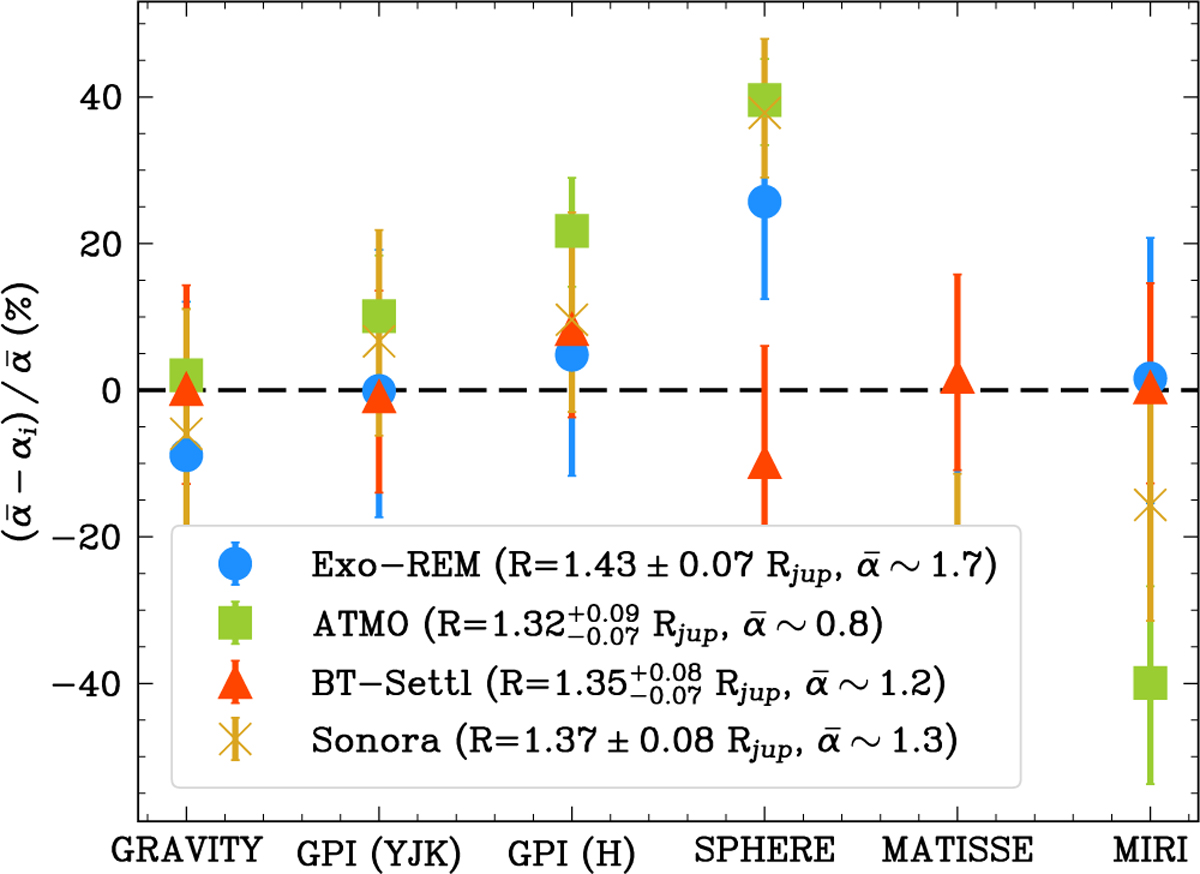
Evolution of the relative scaling parameters ![]() with respect to the dataset considered. αi is the scaling parameter for the i-th observation, while
with respect to the dataset considered. αi is the scaling parameter for the i-th observation, while ![]() is the mean of αi taken over all i.
is the mean of αi taken over all i. ![]() values for each model are reported in the legend. Only datasets with continuum information were rescaled. Each color represents one of the model tested: blue for Exo-REM, green for ATMO, red for BT-Settl, and orange for Sonora. The error bars correspond to the lower and upper bonds in the parameter space encompassing 68% of the retrieved solutions around the best fit.
values for each model are reported in the legend. Only datasets with continuum information were rescaled. Each color represents one of the model tested: blue for Exo-REM, green for ATMO, red for BT-Settl, and orange for Sonora. The error bars correspond to the lower and upper bonds in the parameter space encompassing 68% of the retrieved solutions around the best fit.
Current usage metrics show cumulative count of Article Views (full-text article views including HTML views, PDF and ePub downloads, according to the available data) and Abstracts Views on Vision4Press platform.
Data correspond to usage on the plateform after 2015. The current usage metrics is available 48-96 hours after online publication and is updated daily on week days.
Initial download of the metrics may take a while.