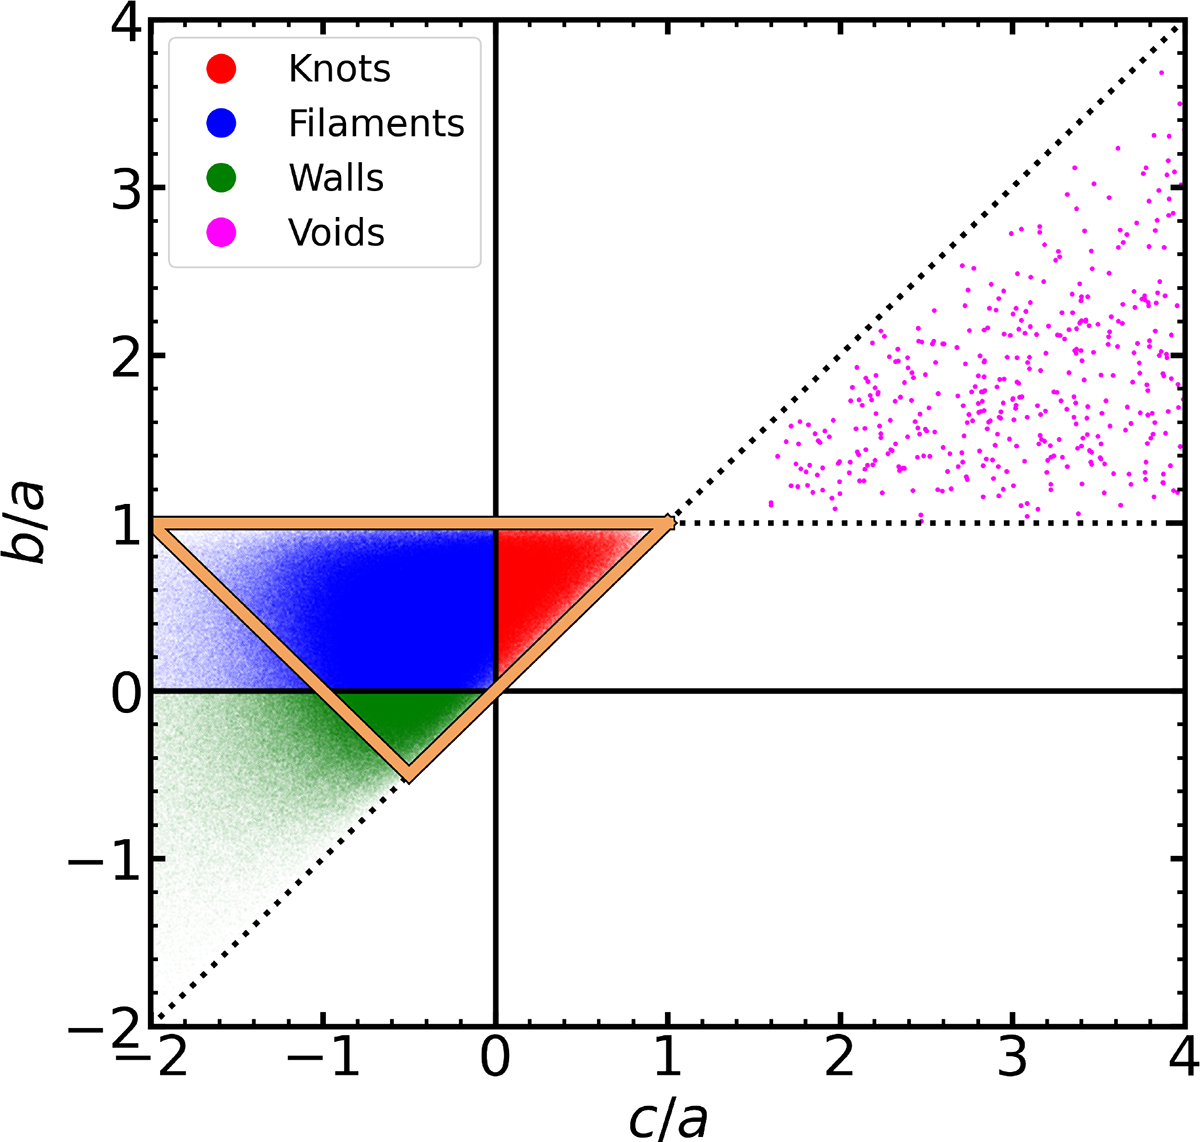
Fig. 1.
Download original image
Relationship between the eigenvalue ratios b/a and c/a for central galaxies, according to conventional classification of the cosmic web, using the threshold λth = 0. Each point corresponds to one galaxy, which is color-coded according to the eigenvalues associated with the cell it occupies as indicated by the legend. The size of the magenta points has been arbitrarily increased for visibility, as they are very sparse. The dotted black lines delineate the regions that the eigenvalue ratios may occupy. The horizontal dotted black line at b/a = 1 indicates that b/a < 1 whenever a > 0 and b/a > 1 only when a < 0. The positively sloped dotted black line indicates the condition a > b > c, which implies b/a > c/a if a > 0 and b/a < c/a if a < 0. The area inside (outside) the orange triangle corresponds to δ > 0 (δ < 0).
Current usage metrics show cumulative count of Article Views (full-text article views including HTML views, PDF and ePub downloads, according to the available data) and Abstracts Views on Vision4Press platform.
Data correspond to usage on the plateform after 2015. The current usage metrics is available 48-96 hours after online publication and is updated daily on week days.
Initial download of the metrics may take a while.