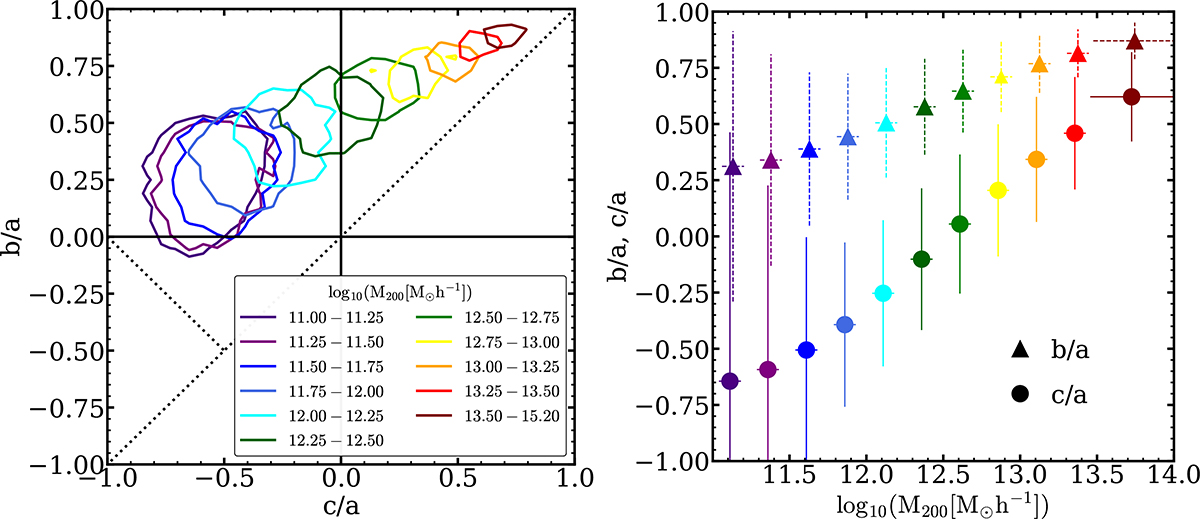
Fig. 2.
Download original image
Eigenvalue ratios, b/a and c/a, as a function of the logarithm of the halo mass (M200). Left panel: b/a as a function of c/a in bins of the logarithm of halo mass. This panel shows a zoomed-in view of the region displayed in Fig. 1, centered at origin. The dotted black lines delineate the regions that the eigenvalue ratios may occupy. The upper limit of the graph, b/a = 1, indicates that b/a < 1 whenever a > 0. The positively sloped dotted black line indicates the condition a > b > c, which implies b/a > c/a if a > 0 and b/a < c/a if a < 0. Right panel: Median values of b/a (triangles) and c/a (circles) for equal bins of the logarithm of the halo mass, as a function of the logarithm of the halo mass. In both panels, each color corresponds to each halo mass bin, as indicated by the legend.
Current usage metrics show cumulative count of Article Views (full-text article views including HTML views, PDF and ePub downloads, according to the available data) and Abstracts Views on Vision4Press platform.
Data correspond to usage on the plateform after 2015. The current usage metrics is available 48-96 hours after online publication and is updated daily on week days.
Initial download of the metrics may take a while.