Fig. 4.
Download original image
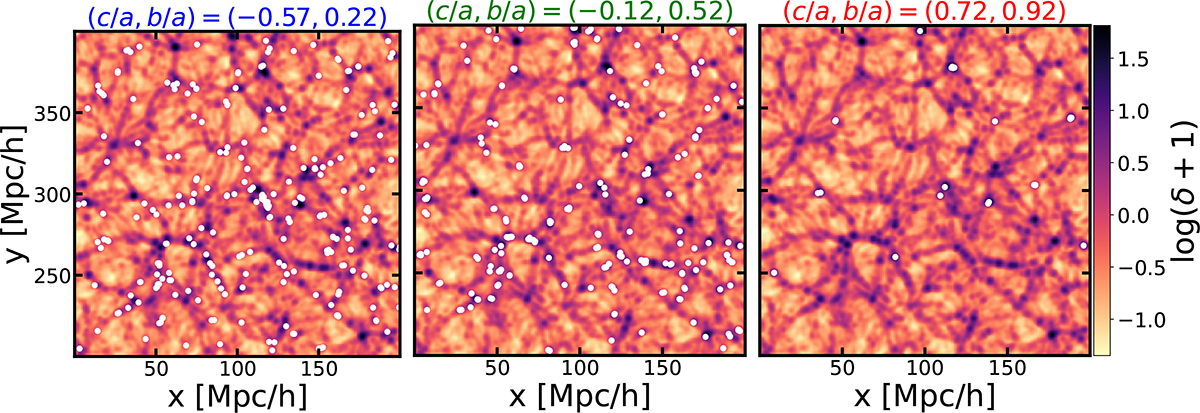
Spatial distribution of central galaxies, in a slice of 1 Mpc h−1 in a box of the SMDPL simulation. The background shows the logarithm of the density contrast estimated from DM particles, where the colors correspond to the values indicated in the color bar. White filled circles represent galaxies located in environments where the values of their eigenvalue ratios b/a and c/a (corresponding to the cell in which they are located) fall within a circle of radius 0.1 Mpc h−1 centered on the peaks of three of the contours in the left panel of Fig. 3 marked with crosses. The panels correspond to the blue (left), green (middle), and red crosses (right). Above each panel, the (c/a, b/a) values are indicated for each cross.
Current usage metrics show cumulative count of Article Views (full-text article views including HTML views, PDF and ePub downloads, according to the available data) and Abstracts Views on Vision4Press platform.
Data correspond to usage on the plateform after 2015. The current usage metrics is available 48-96 hours after online publication and is updated daily on week days.
Initial download of the metrics may take a while.