Open Access
Fig. 3
Download original image
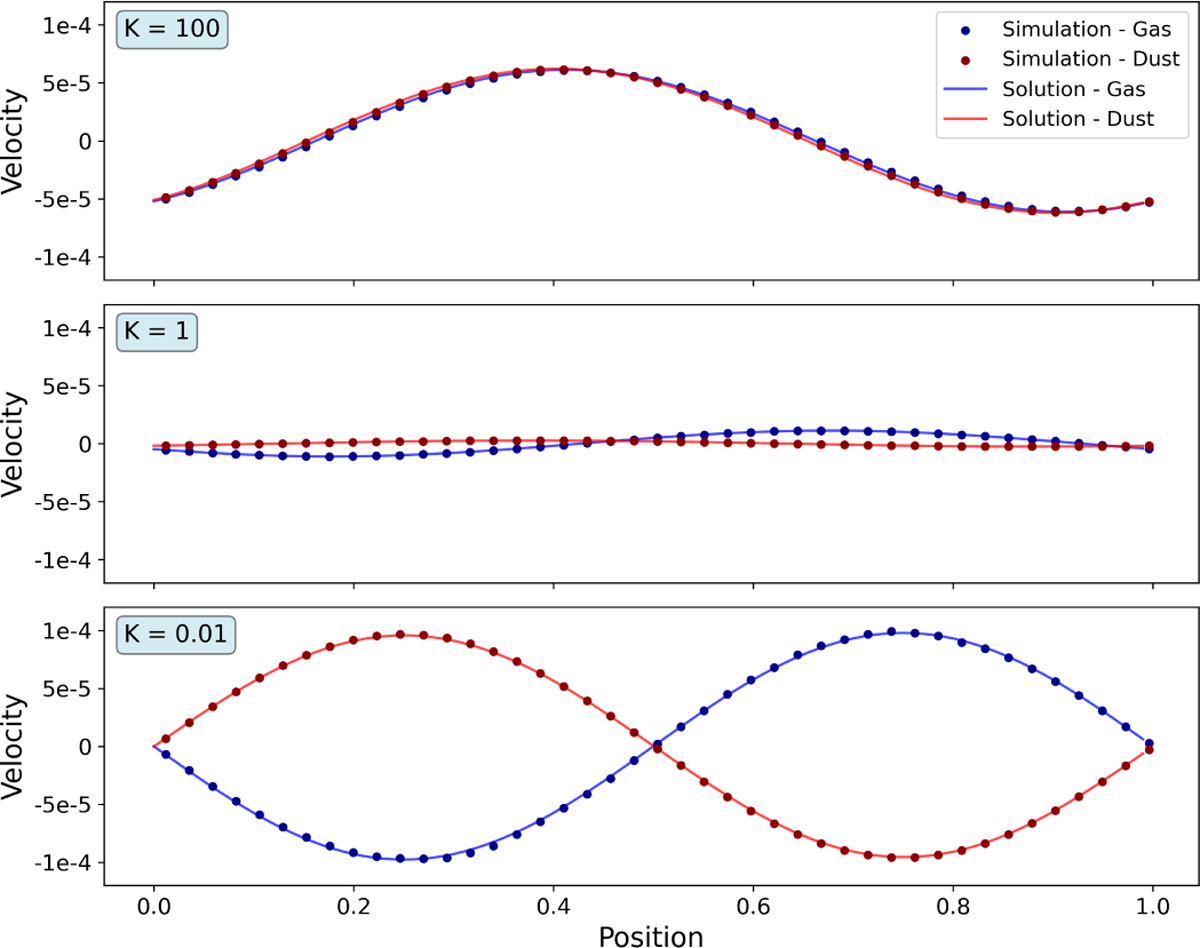
Results from the DUSTYWAVE benchmark test, for three different values of drag coefficient K. The continuous lines represent the analytical solution and the dots the output of the simulations. Gas and dust velocities are plotted separately.
Current usage metrics show cumulative count of Article Views (full-text article views including HTML views, PDF and ePub downloads, according to the available data) and Abstracts Views on Vision4Press platform.
Data correspond to usage on the plateform after 2015. The current usage metrics is available 48-96 hours after online publication and is updated daily on week days.
Initial download of the metrics may take a while.