Open Access
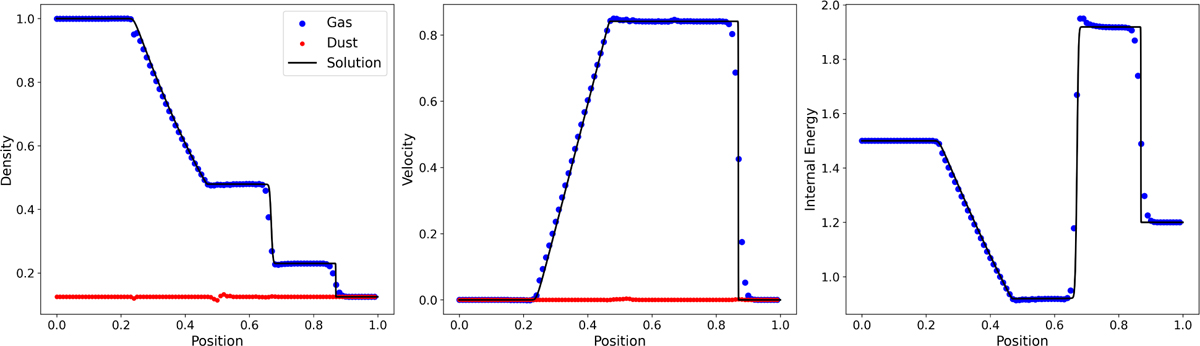
Fig. 4
Download original image
DUSTYSHOCK benchmark test for zero drag. The blue and red dots represent the output of the simulation for gas and dust, respectively, while the continuous line shows the solution for the gas evolution. As expected, while the gas undergoes the typical Sod shock tube evolution, the dust remains unperturbed.
Current usage metrics show cumulative count of Article Views (full-text article views including HTML views, PDF and ePub downloads, according to the available data) and Abstracts Views on Vision4Press platform.
Data correspond to usage on the plateform after 2015. The current usage metrics is available 48-96 hours after online publication and is updated daily on week days.
Initial download of the metrics may take a while.