Fig. 5
Download original image
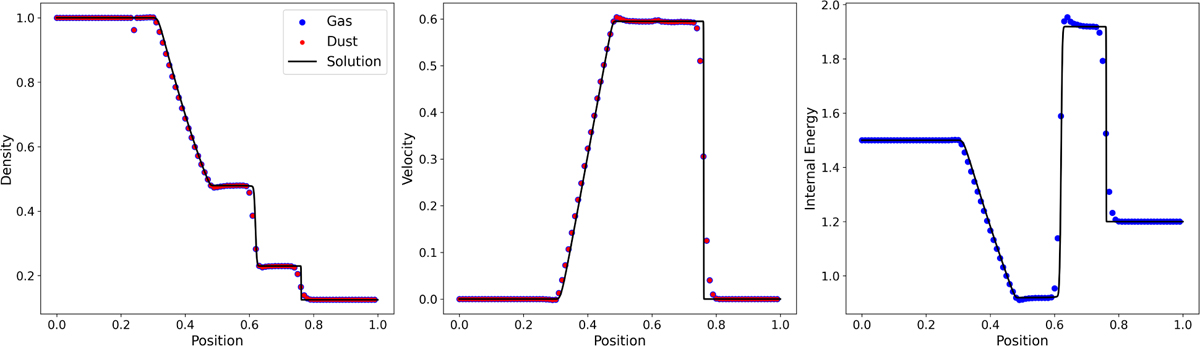
DUSTYSHOCK benchmark test for strong drag (K=106). The blue and red dots represent the output of the simulation for gas and dust, respectively, while the continuous line shows the solution for the gas evolution. The evolution of the dust now closely follows the gas, and both evolve at a lower speed compared to a gas-only simulation, with the modified sound speed shown in Eq. (86).
Current usage metrics show cumulative count of Article Views (full-text article views including HTML views, PDF and ePub downloads, according to the available data) and Abstracts Views on Vision4Press platform.
Data correspond to usage on the plateform after 2015. The current usage metrics is available 48-96 hours after online publication and is updated daily on week days.
Initial download of the metrics may take a while.