Fig. 8
Download original image
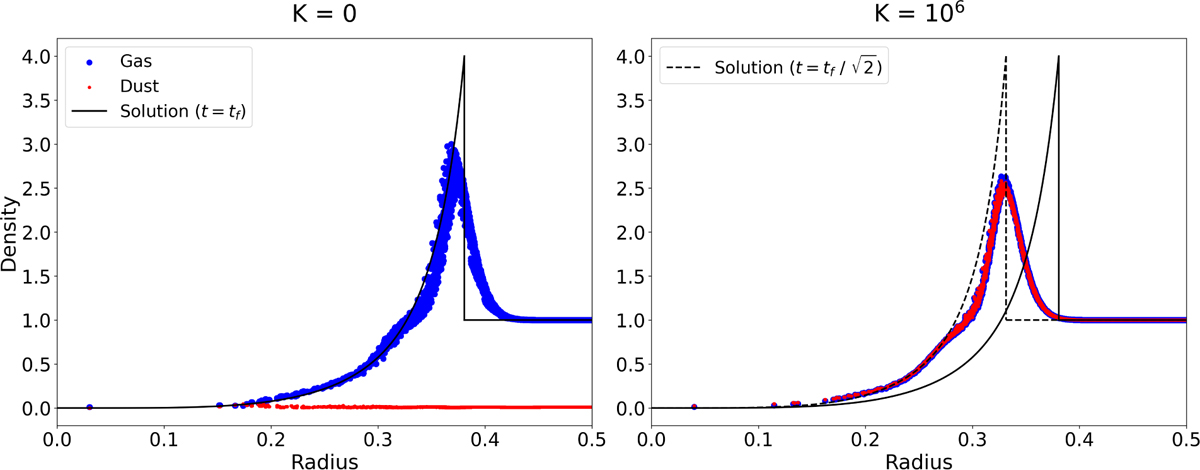
Dusty Sedov-Taylor blast wave for a dust and gas mixture in two regimes, K=0 (left) and K=106 (right). The radial density profiles are shown as blue dots for gas and red dots for dust, and the self-similar solution at t=tf is plotted as a continuous black line. The simulation correctly keeps dust at rest while the gas evolves following the self-similar solution, for uncoupled dust. For strongly coupled gas and dust, the mixture follows the self-similar solution evaluated at a previous time, consistent with the modified sound speed in Eq. (86), shown as a dashed black line.
Current usage metrics show cumulative count of Article Views (full-text article views including HTML views, PDF and ePub downloads, according to the available data) and Abstracts Views on Vision4Press platform.
Data correspond to usage on the plateform after 2015. The current usage metrics is available 48-96 hours after online publication and is updated daily on week days.
Initial download of the metrics may take a while.