Open Access
Fig. 2
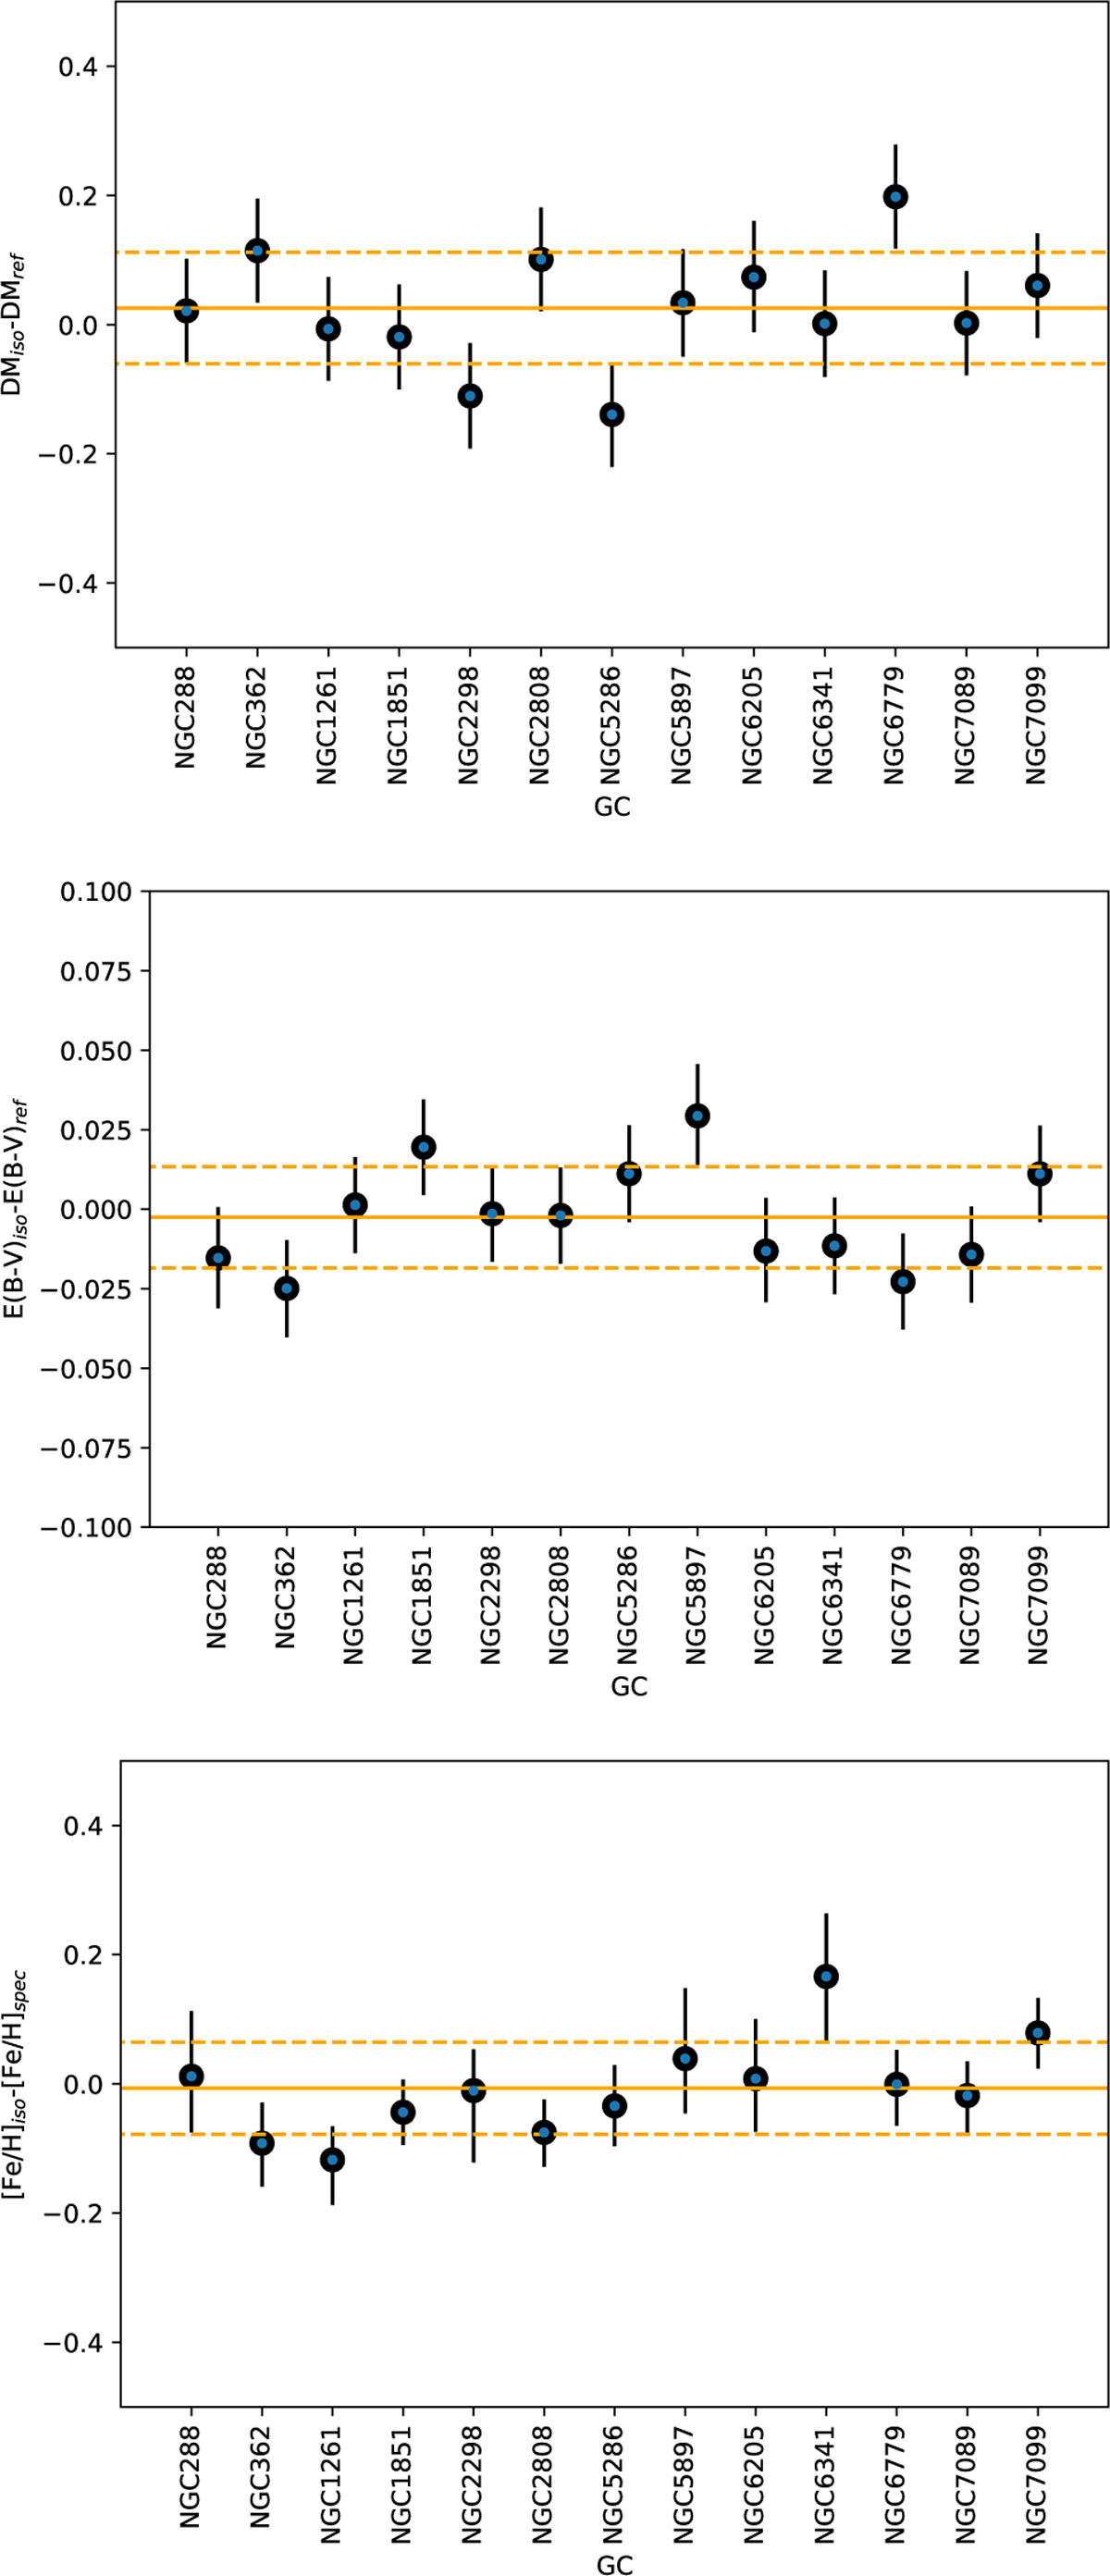
Download original image
Difference between literature values and the parameters obtained as output of the isochrone fitting for the true distance modulus (top panel), colour excess (middle panel), and metallicity (bottom panel). The solid and dashed lines mark the mean value and the dispersion around the mean of each distribution.
Current usage metrics show cumulative count of Article Views (full-text article views including HTML views, PDF and ePub downloads, according to the available data) and Abstracts Views on Vision4Press platform.
Data correspond to usage on the plateform after 2015. The current usage metrics is available 48-96 hours after online publication and is updated daily on week days.
Initial download of the metrics may take a while.