Open Access
Fig. B.6
Download original image
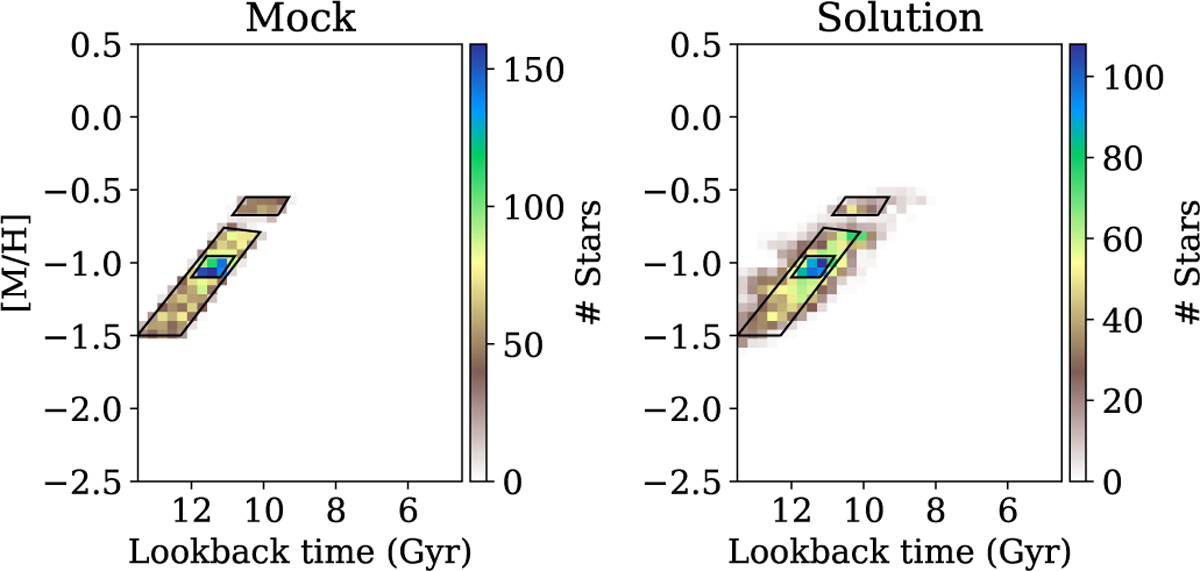
Same as Fig. B.2 but with the mock defined in Appendix B.2. Note that the histogram binning has been selected much finer than in previous plots, to show smaller details granted by the larger number of stars. In the left panel, some stars seem to fall outside of the defined regions, this is purely an effect of the binning.
Current usage metrics show cumulative count of Article Views (full-text article views including HTML views, PDF and ePub downloads, according to the available data) and Abstracts Views on Vision4Press platform.
Data correspond to usage on the plateform after 2015. The current usage metrics is available 48-96 hours after online publication and is updated daily on week days.
Initial download of the metrics may take a while.