Open Access
Fig. 2
Download original image
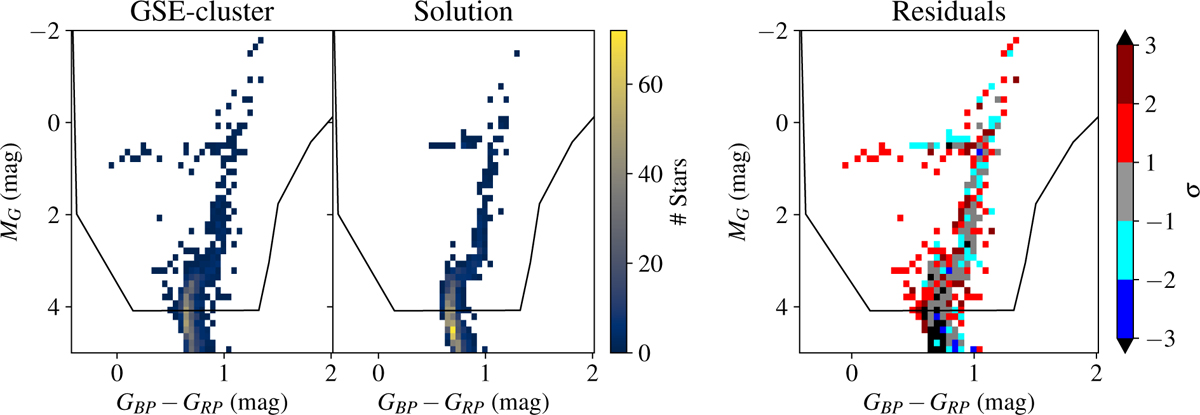
CMD of GSE-cluster sample and corresponding fit and residuals. Left panels: quality-cut GSE-cluster sample and corresponding solution CMD of our best-fit deSFH. Only the stars inside the region defined by the solid black line are considered for the fit. Rightmost panel: Poissonian residuals as ![]() .
.
Current usage metrics show cumulative count of Article Views (full-text article views including HTML views, PDF and ePub downloads, according to the available data) and Abstracts Views on Vision4Press platform.
Data correspond to usage on the plateform after 2015. The current usage metrics is available 48-96 hours after online publication and is updated daily on week days.
Initial download of the metrics may take a while.