Fig. 3
Download original image
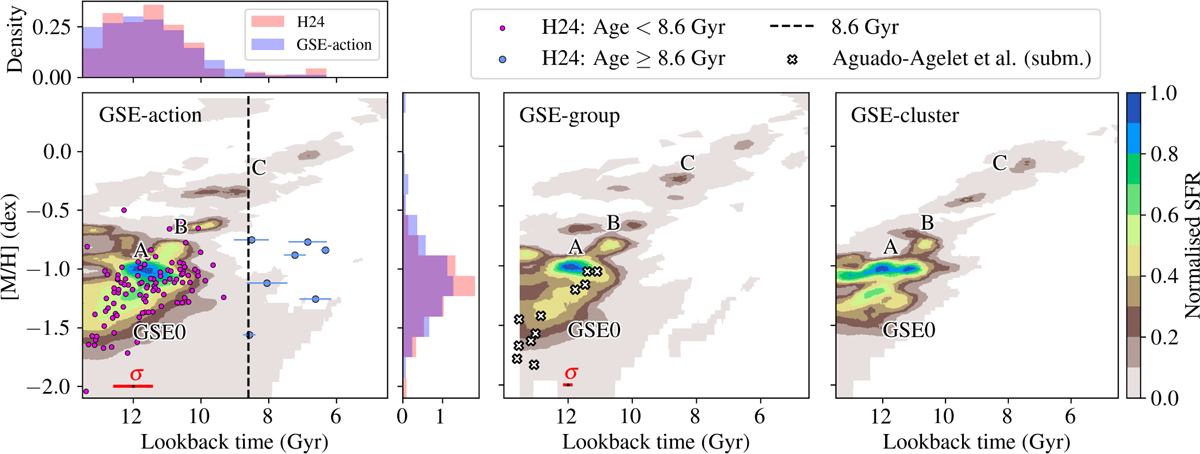
deSFH results for the three samples analysed in this work are shown as filled contour plots of SFR as a function of age and metallicity. The values have been normalised by dividing by the maximum. In all of them, there are four shared features: populations A, B, C, and tail GSE0. In the GSE-action panel, datapoints representing ages and metallicities for individual stars from Horta et al. (2024) are shown, colour-coded as stars older (magenta) and younger (blue) than 8.6 Gyr. For the younger stars, the age error bars are shown, while for the older stars, the value of the median uncertainty, σ=0.55, is plotted in the lower-left corner. In the GSE-group panel, ages and metallicities of globular clusters (GC) associated with GSE by Aguado-Agelet et al. (2025) are represented with white crosses. The median uncertainty, σ=0.1 in the ages of these clusters is shown in the lower left corner. The age range in this middle panel is adjusted in the old limit to accommodate all GCs data (as an age limit of 14 Gyr is adopted for the clusters).
Current usage metrics show cumulative count of Article Views (full-text article views including HTML views, PDF and ePub downloads, according to the available data) and Abstracts Views on Vision4Press platform.
Data correspond to usage on the plateform after 2015. The current usage metrics is available 48-96 hours after online publication and is updated daily on week days.
Initial download of the metrics may take a while.