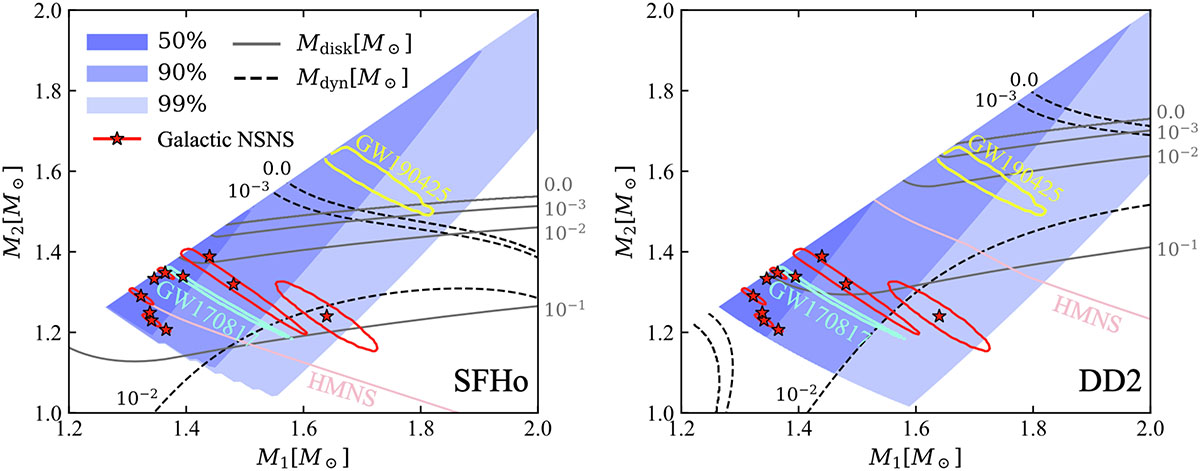
Fig. A.1.
Download original image
Mass distribution of our NSNS population in the M1, M2 plane. The filled blue coloured regions contain 50%, 90%, and 99% of the binaries. The black dashed lines and the grey lines represent respectively the contours for the predicted dynamical ejecta and disc mass, assuming the SFHo EoS (left panel) and the DD2 EoS (right panel). The pink line indicates the condition for a HMNS remnant (Mrem > 1.2MTOV). Red stars and contours show the best fit and 90% credible regions for the known Galactic NSNS (Özel & Freire 2016; Farrow et al. 2019) systems that merge within a Hubble time. Yellow and aquamarine lines represent the 50% confidence regions for the component masses in GW190425 (Abbott et al. 2020a) and GW170817 (Abbott et al. 2019), both constructed using the publicly available low-spin-prior posterior samples.
Current usage metrics show cumulative count of Article Views (full-text article views including HTML views, PDF and ePub downloads, according to the available data) and Abstracts Views on Vision4Press platform.
Data correspond to usage on the plateform after 2015. The current usage metrics is available 48-96 hours after online publication and is updated daily on week days.
Initial download of the metrics may take a while.