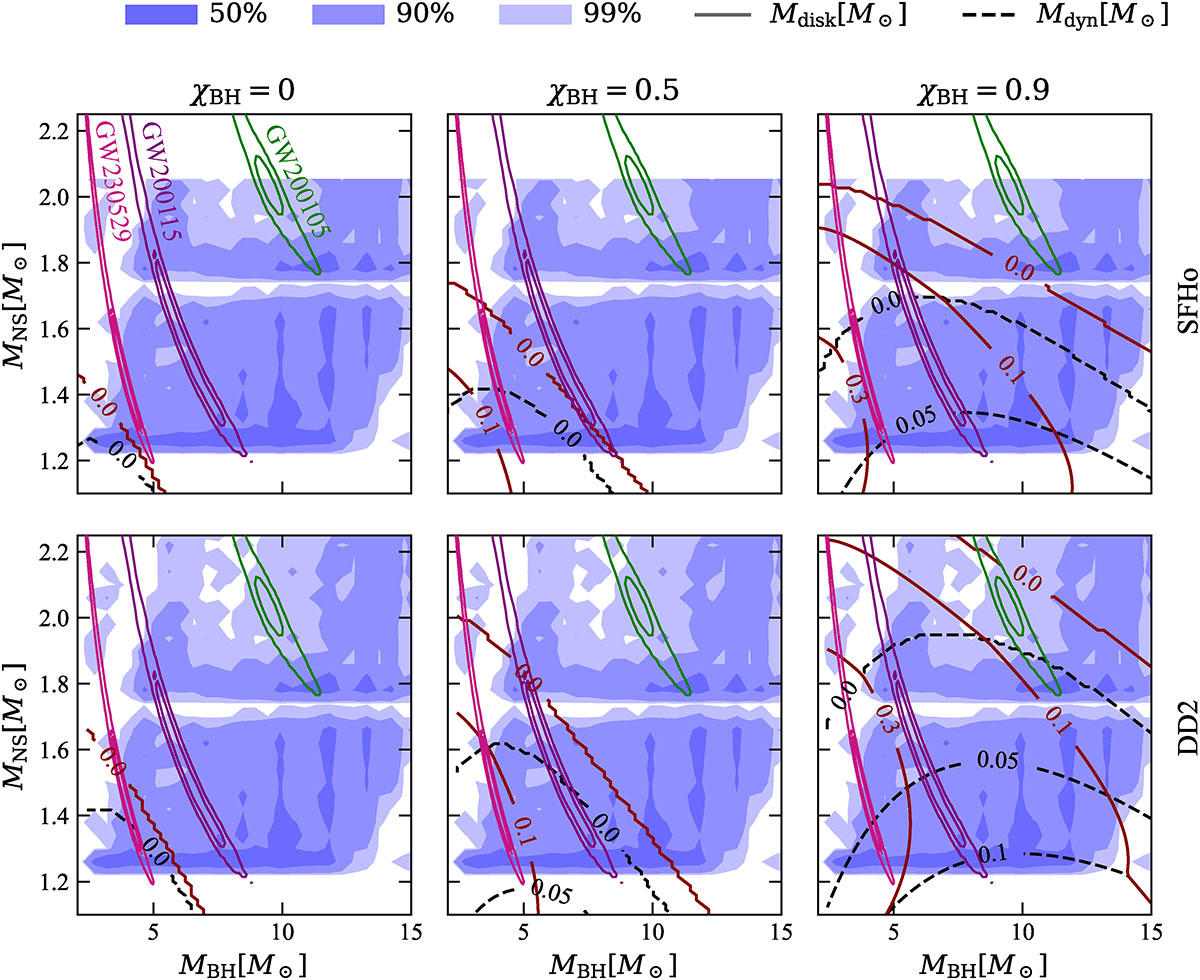
Fig. A.2.
Download original image
Mass distribution of our BHNS population at redshift z = 0 (fiducial model in Broekgaarden et al. (2021)) in the MNS, MBH plane. The filled blue coloured regions contain 50%, 90%, and 99% of the binaries. The black dashed lines and the dark red lines represent respectively the contours for the predicted dynamical ejecta and disc mass, assuming the SFHo EoS (upper panel) and the DD2 EoS (lower panel). Violet and green lines represent the 50% and 90% confidence regions for the component masses in GW200115, GW200105 (Abbott et al. 2021) and GW230529, both constructed using the publicly available low-spin-prior posterior samples.
Current usage metrics show cumulative count of Article Views (full-text article views including HTML views, PDF and ePub downloads, according to the available data) and Abstracts Views on Vision4Press platform.
Data correspond to usage on the plateform after 2015. The current usage metrics is available 48-96 hours after online publication and is updated daily on week days.
Initial download of the metrics may take a while.