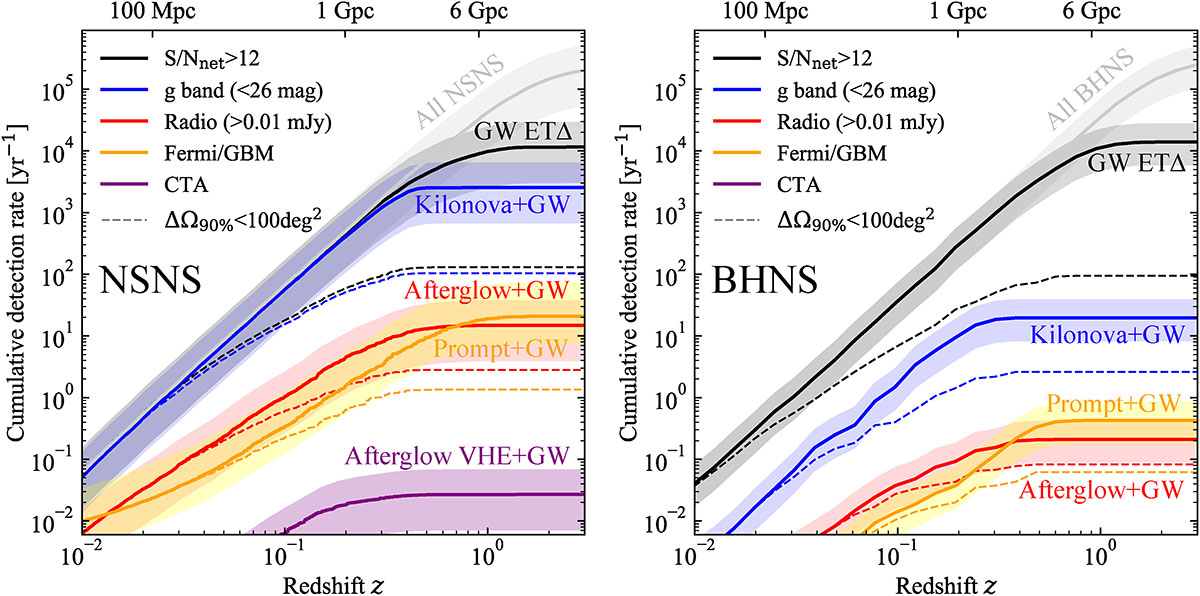
Fig. 3.
Download original image
Cumulative multi-messenger detection rates as a function of redshift (luminosity distance) for our fiducial NSNS and BHNS population (SFHo EoS, non-spinning BHs), assuming the ET triangle 10 km configuration. Left panel: NSNS population. The light grey line (“All NSNS”) represents the intrinsic merger rate for the NSNS population, with the grey band showing its uncertainty due to that on the local merger rate. This uncertainty propagates as a constant relative error to all the other rates. The black (“GW ET”) line is the cumulative GW detection rate (events per year with network S/N ≥ 12). The blue (“Kilonova+GW”), red (“Afterglow+GW”), purple (“Afterglow VHE+GW”) and orange (“Prompt+GW”) lines are the cumulative detection rates for the joint detection of ET GW plus a KN (g band), a GRB afterglow (radio and VHE bands), or a GRB prompt (the orange and purple lines account, respectively, for the Fermi/GBM and CTA duty cycle and field of view). The dashed lines are the cumulative detection rates assuming only the binaries with ΔΩ90% < 100 deg2. The assumed thresholds or instruments sensitivity are shown in the legend. Right panel: Same as the left panel but for the BHNS population.
Current usage metrics show cumulative count of Article Views (full-text article views including HTML views, PDF and ePub downloads, according to the available data) and Abstracts Views on Vision4Press platform.
Data correspond to usage on the plateform after 2015. The current usage metrics is available 48-96 hours after online publication and is updated daily on week days.
Initial download of the metrics may take a while.