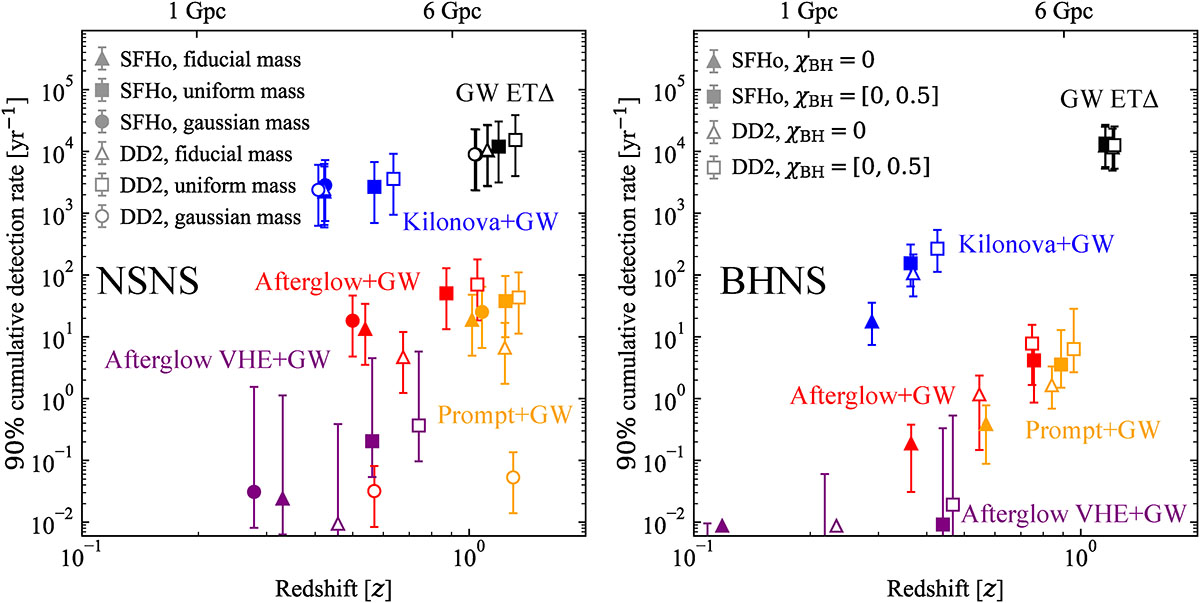
Fig. 4.
Download original image
Predicted 90th percentile of the cumulative multi-messenger detection rates for our NSNS and BHNS population model variations. Left panel: NSNS fiducial population, assuming ET triangle 10 km configuration and EM bands and detection limits reported in Figure 3. Different colours refer to different counterparts as in Figure 3. Different marker shapes indicate different adopted mass distributions (triangle: fiducial; square: uniform; circle: Gaussian). Filled markers indicate the SFHo EoS, while empty markers are for the DD2 EoS. The error bars indicate the uncertainty on the local merger rate and for the “Afterglow VHE+GW” channel also a variation on the median circum-burst density. Right panel: BHNS fiducial population, assuming ET triangle 10 km configuration and EM limits reported in Table 2. Different marker shapes indicate different adopted BH spin distributions (triangle: χBH = 0; square: uniform between 0 and 0.5). Filled markers indicate the SFHo EoS, while empty markers are for the DD2 EoS. The error bars indicate the uncertainty on the local merger rate. For GRB afterglow and prompt they also take into account a variation on the jet core half-opening angle (θj = 15°) and for the Afterglow VHE also a variation on the median circum-burst density.
Current usage metrics show cumulative count of Article Views (full-text article views including HTML views, PDF and ePub downloads, according to the available data) and Abstracts Views on Vision4Press platform.
Data correspond to usage on the plateform after 2015. The current usage metrics is available 48-96 hours after online publication and is updated daily on week days.
Initial download of the metrics may take a while.