Fig. 5.
Download original image
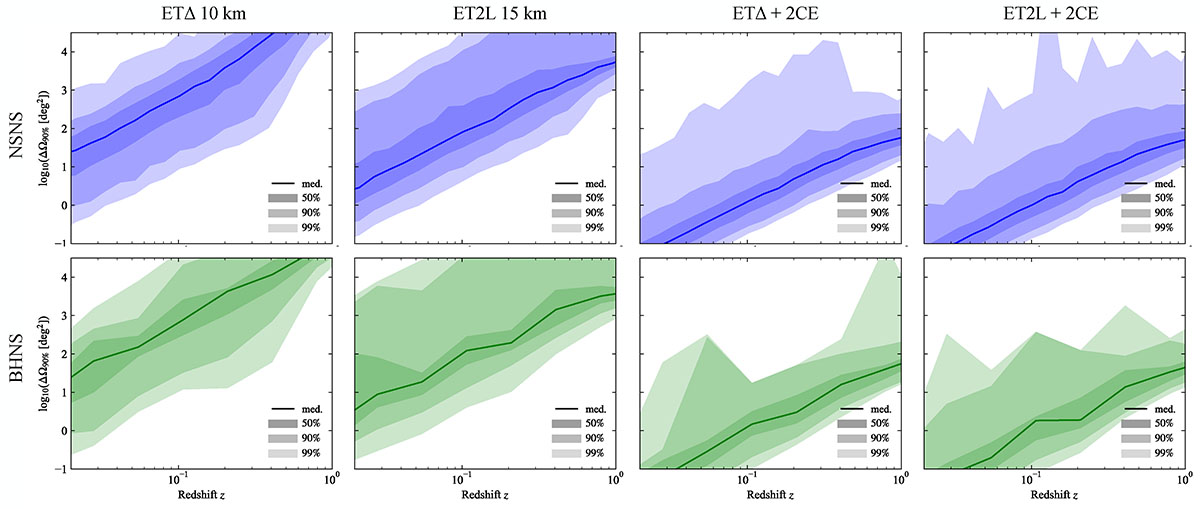
Distribution of the extent of the 90% sky localization region of GW-detected NSNS events (upper row) and BHNS events (lower row) that are capable of producing an EM counterpart, as a function of redshift. Different columns refer to ETΔ (first column), ET2L (second column), ETΔ+2CE (third column), and ET2L+2CE (four column). The solid line represents the median, while the coloured bands encompass the 50%, 90%, and 99% credible interval at each fixed redshift.
Current usage metrics show cumulative count of Article Views (full-text article views including HTML views, PDF and ePub downloads, according to the available data) and Abstracts Views on Vision4Press platform.
Data correspond to usage on the plateform after 2015. The current usage metrics is available 48-96 hours after online publication and is updated daily on week days.
Initial download of the metrics may take a while.