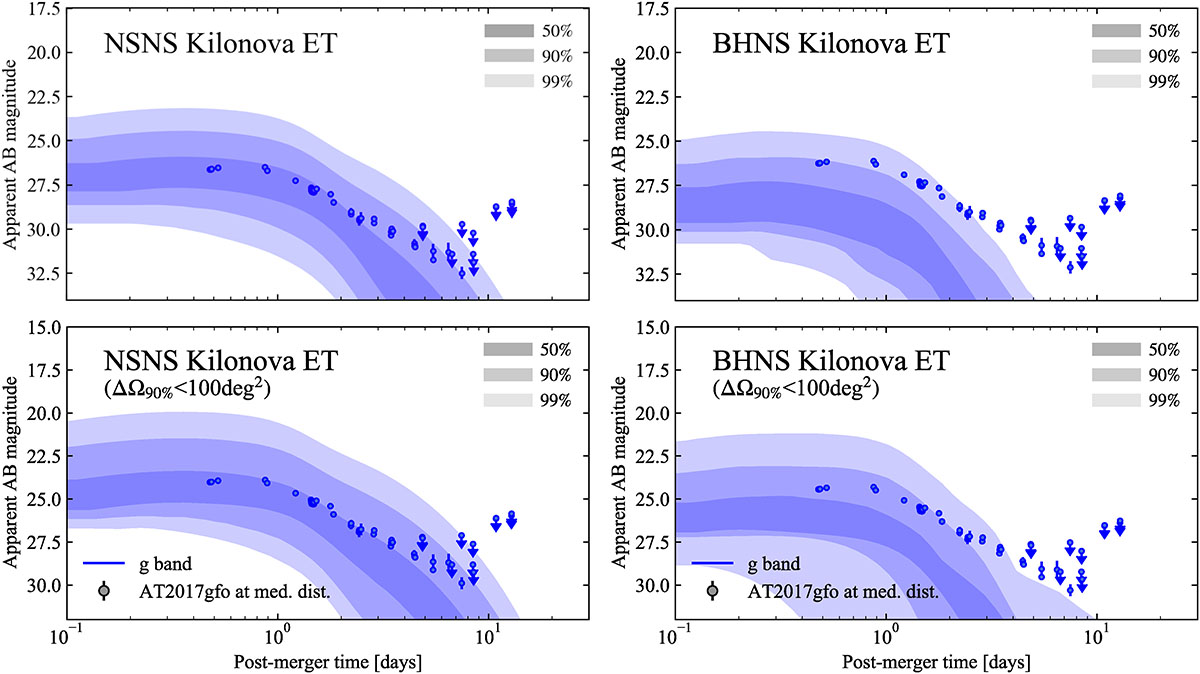
Fig. 7.
Download original image
Distribution of optical KN brightness as a function of time for ET-detectable (assuming ETΔ) events in our NSNS (left column) and BHNS (right column) populations. The shaded regions contain 50%, 90%, and 99% of the KN light curves in the g (484 nm) band. Coloured circles show extinction-corrected AT2017gfo data rescaled to the median distance of the considered populations (upper limits are marked with a downward arrow, data from Villar et al. 2017). The bottom row shows the result restricted to binaries with ΔΩ90% < 100 deg2.
Current usage metrics show cumulative count of Article Views (full-text article views including HTML views, PDF and ePub downloads, according to the available data) and Abstracts Views on Vision4Press platform.
Data correspond to usage on the plateform after 2015. The current usage metrics is available 48-96 hours after online publication and is updated daily on week days.
Initial download of the metrics may take a while.