Fig. 8.
Download original image
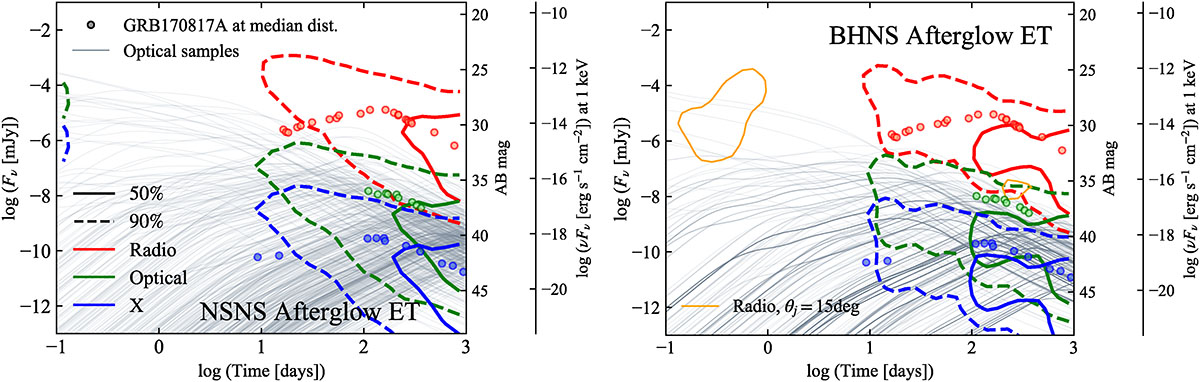
Distribution of brightness versus time for GRB afterglows associated with ET-detectable NSNS (left panel) and BHNS (right panel) mergers. Solid and dashed contours contain 50% and 90% of the peaks, respectively. Red, green, and blue colours refer to the radio (Fν at 1.4 × 10⁹ Hz), optical (AB magnitude at 4.8 × 10¹⁴ Hz), and X-rays (νFν at 1 keV), respectively. The coloured circles are the observed data of GRB170817A (Makhathini et al. 2021) at the median distance of our population. The grey lines in the background are a random sample of optical light curves from the underlying population. We assume for both the populations the same jet half-opening angle, θj = 3.4 deg. In the BHNS panel, we also show with orange solid lines the 50% contour for radio peaks when assuming θj = 15 deg.
Current usage metrics show cumulative count of Article Views (full-text article views including HTML views, PDF and ePub downloads, according to the available data) and Abstracts Views on Vision4Press platform.
Data correspond to usage on the plateform after 2015. The current usage metrics is available 48-96 hours after online publication and is updated daily on week days.
Initial download of the metrics may take a while.