Fig. 1
Download original image
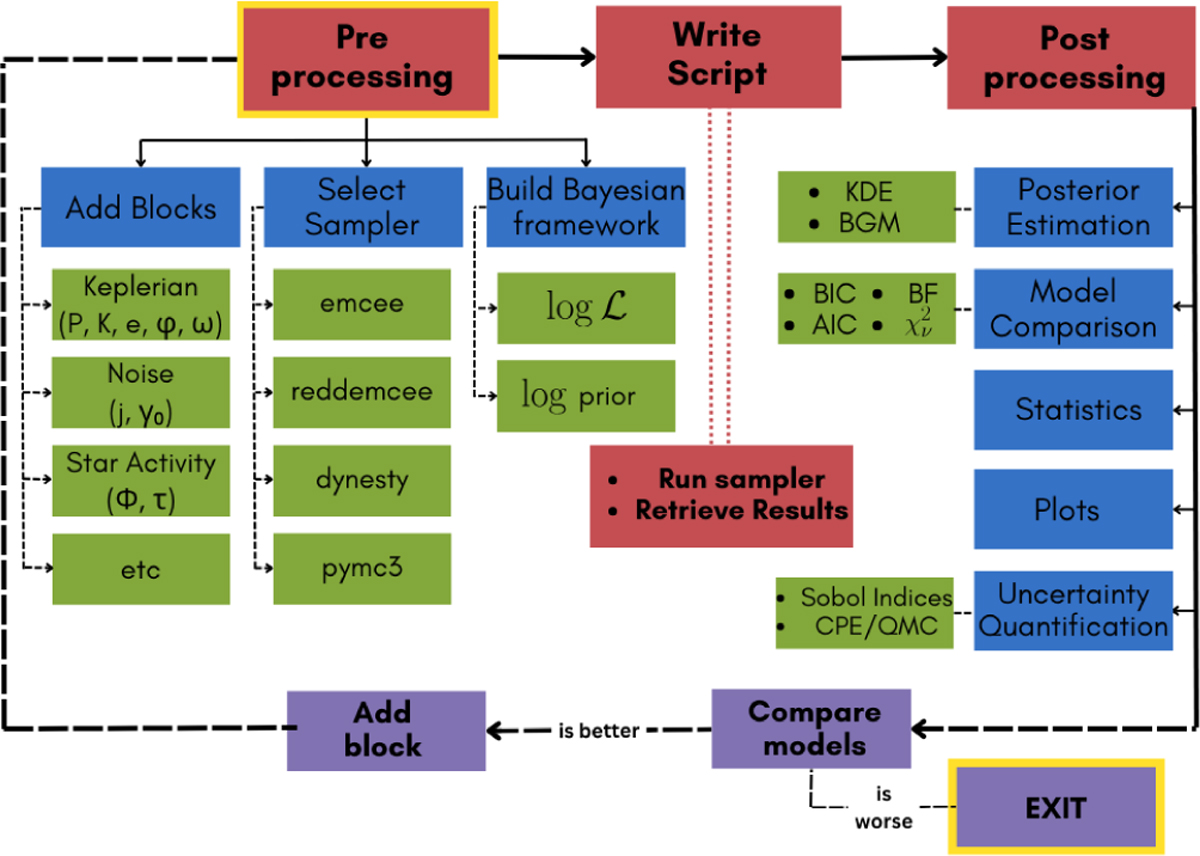
Three distinct steps of the code, shown in red: pre-processing, where user inputs and data are read; run compilation, where the code is executed; and post-processing, where statistical measures are calculated. The purple blocks with dashed arrows represent the optional step of repeating the loop. Blue highlights the main stages of each step, and available alternatives are displayed in green.
Current usage metrics show cumulative count of Article Views (full-text article views including HTML views, PDF and ePub downloads, according to the available data) and Abstracts Views on Vision4Press platform.
Data correspond to usage on the plateform after 2015. The current usage metrics is available 48-96 hours after online publication and is updated daily on week days.
Initial download of the metrics may take a while.