Fig. 4
Download original image
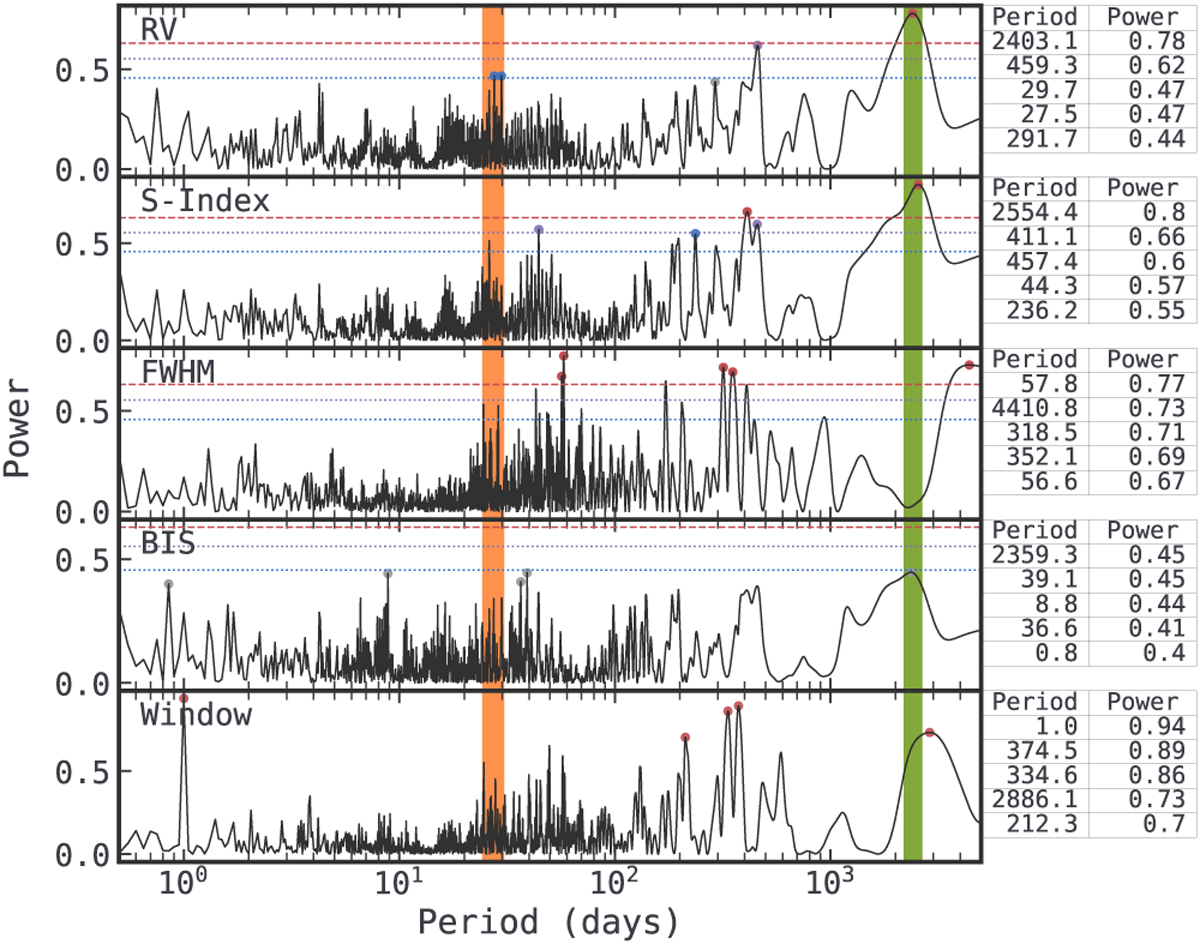
HD 55693 periodogram for TERRA1 data. Descending, RVs, S-Index, FWHM, BIS, and window function. FAP lines included for 10%, 1%, and 0.1%, in dashed red, dotted purple, and dotted blue, respectively. Circle markers show the five periods with the greatest power, coloured by FAP region. The orange coloured region corresponds to Prot = 27.4 ± 3.2 and the green one to ![]() .
.
Current usage metrics show cumulative count of Article Views (full-text article views including HTML views, PDF and ePub downloads, according to the available data) and Abstracts Views on Vision4Press platform.
Data correspond to usage on the plateform after 2015. The current usage metrics is available 48-96 hours after online publication and is updated daily on week days.
Initial download of the metrics may take a while.