Fig. 4
Download original image
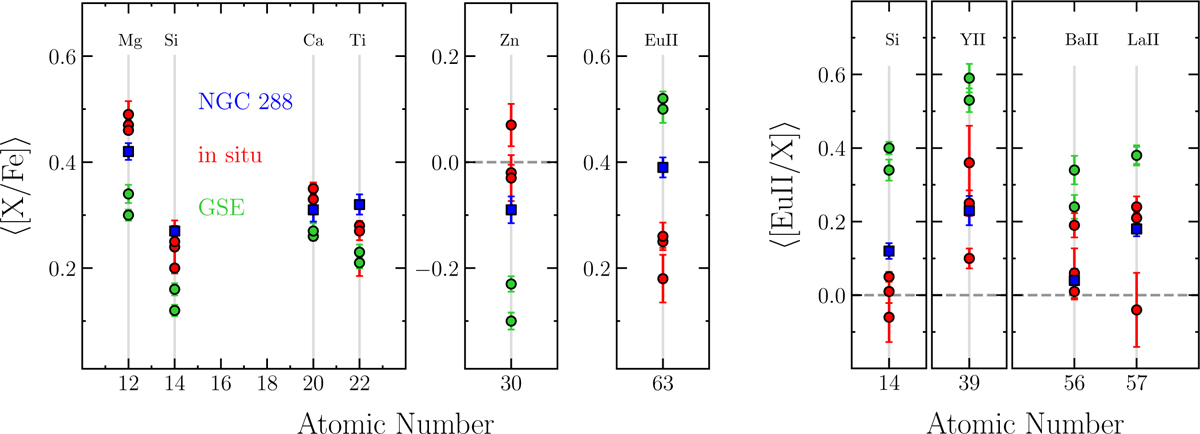
Left panel: difference of mean abundance ratios of the α-elements [Mg/Fe], [Si/Fe], [Ca/Fe], [Ti/Fe], [Zn/Fe], and [EuII/Fe] between NGC 288 and GCs analyzed in C24. GCs are color coded according to their progenitors as in Fig. 3. Right panel: comparison of mean abundance ratios of EuII relative to other chemical elements (i.e. Si, YII, BaII, and LaII). Standard errors associated with the mean abundances are also reported.
Current usage metrics show cumulative count of Article Views (full-text article views including HTML views, PDF and ePub downloads, according to the available data) and Abstracts Views on Vision4Press platform.
Data correspond to usage on the plateform after 2015. The current usage metrics is available 48-96 hours after online publication and is updated daily on week days.
Initial download of the metrics may take a while.