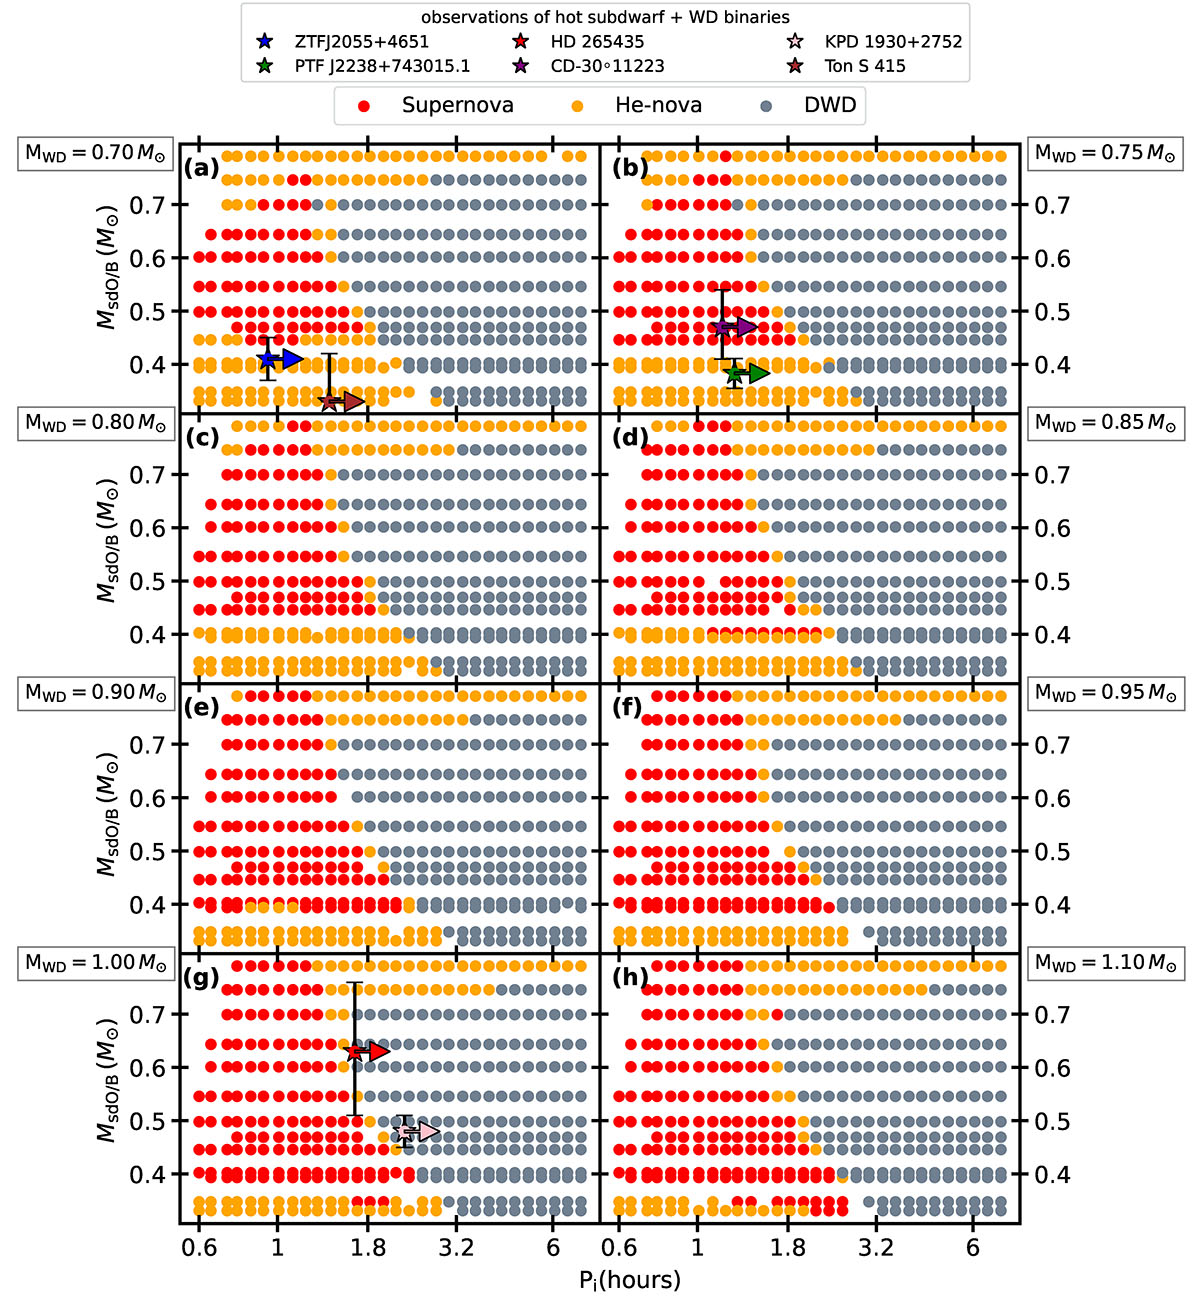
Fig. 6.
Download original image
Mapping of outcomes (supernova, He nova, and double white dwarf) across the initial parameter space. The x-axis represents the initial orbital period, and the y-axis represents the initial donor mass (MsdO/B). The 8 sub-panels describe different white dwarf masses, as labeled, that increase from the top left to the bottom right. Red points denote double detonation supernovae, orange points indicate He novae and grey points represent double white dwarfs. The stars highlight observed hot subdwarf + WD binary systems (see Table 2), with arrows indicating that initial orbital periods must be longer than the observed values. The lower mass donors (< 0.4 M⊙) only lead to double detonation supernovae with higher mass accretors (> 0.9 M⊙). For details, see Sect. 4.
Current usage metrics show cumulative count of Article Views (full-text article views including HTML views, PDF and ePub downloads, according to the available data) and Abstracts Views on Vision4Press platform.
Data correspond to usage on the plateform after 2015. The current usage metrics is available 48-96 hours after online publication and is updated daily on week days.
Initial download of the metrics may take a while.