Fig. E.1
Download original image
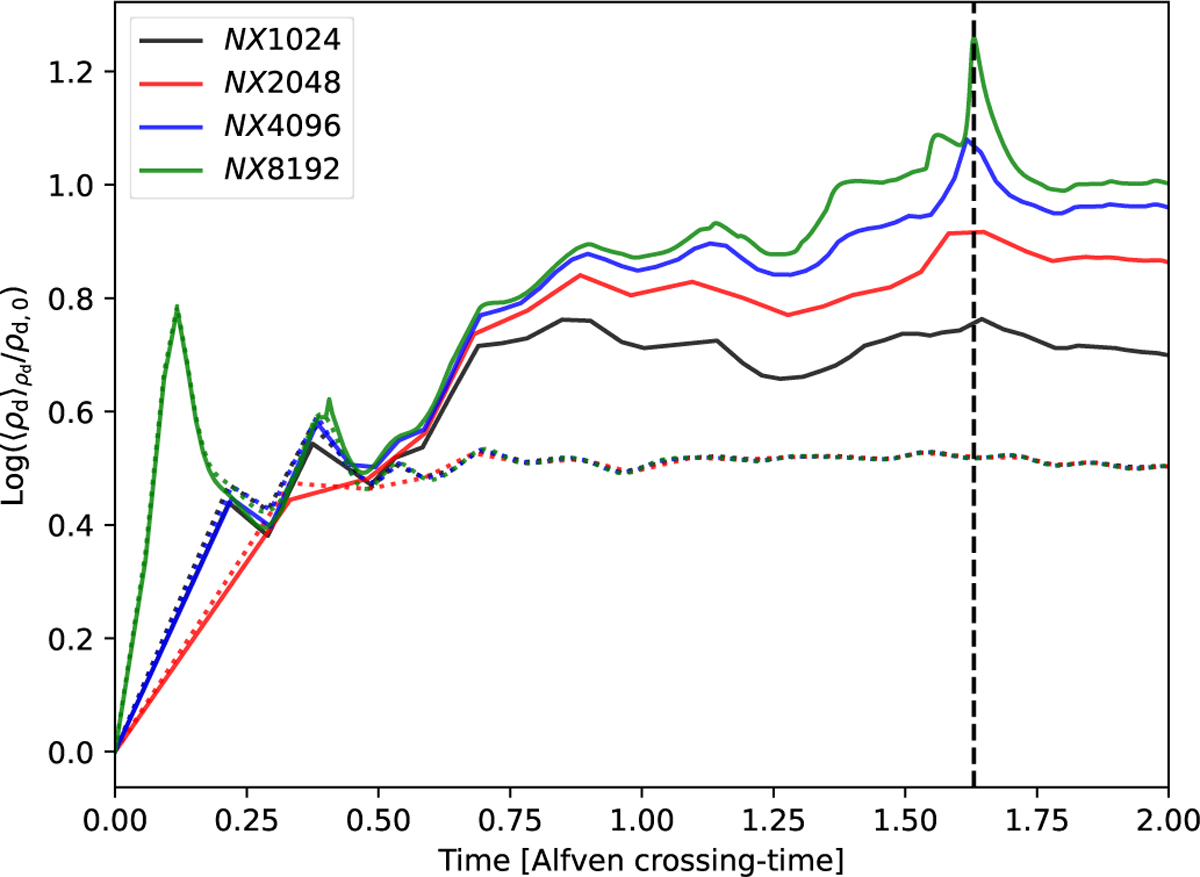
Convergence test. Average dust density (solid) and gas density (dotted) (as defined in Eq. 18) as a function of time for different spatial resolutions. β=1 and sd=100 μm(St=0.1) were used. The vertical dashed black line indicates the time at which Fig. E.2 was made. While convergence is reached for the gas, it is not for the dust.
Current usage metrics show cumulative count of Article Views (full-text article views including HTML views, PDF and ePub downloads, according to the available data) and Abstracts Views on Vision4Press platform.
Data correspond to usage on the plateform after 2015. The current usage metrics is available 48-96 hours after online publication and is updated daily on week days.
Initial download of the metrics may take a while.