Fig. 7
Download original image
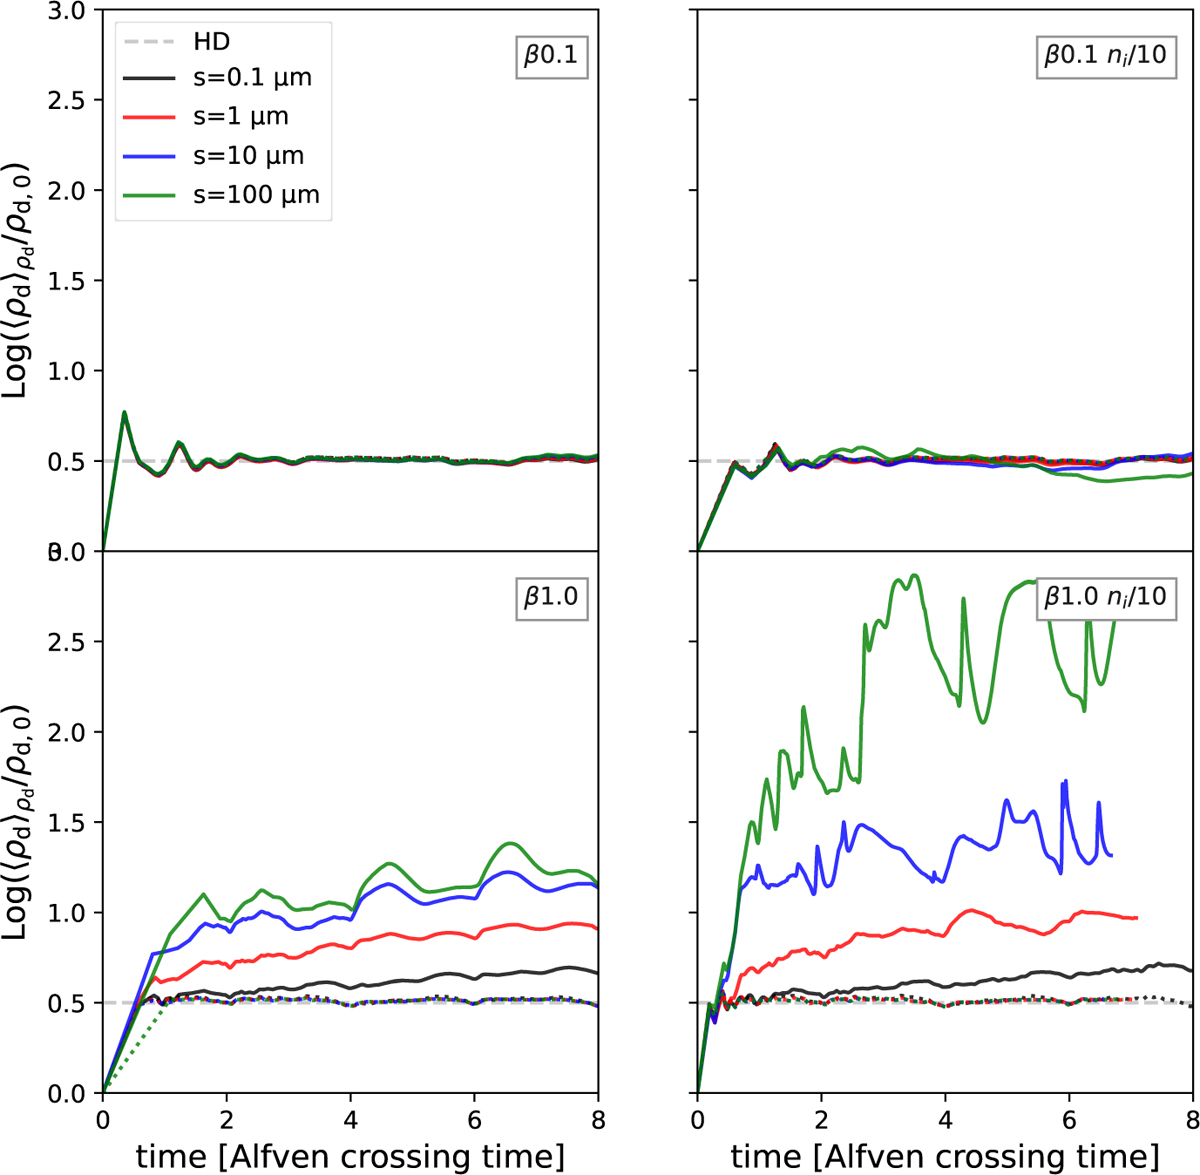
Average (dust density weighted) dust density (solid lines) and average (gas density weighted) gas density (dotted lines) fluctuations as a function of time for different values of the dust grain size sd. Upper left panel: β=0.1. Lower left panel: β=1. Second column: same but with ten times less ions. The dust density mean value for pure hydrodynamics simulations is displayed for reference as dashed lines.
Current usage metrics show cumulative count of Article Views (full-text article views including HTML views, PDF and ePub downloads, according to the available data) and Abstracts Views on Vision4Press platform.
Data correspond to usage on the plateform after 2015. The current usage metrics is available 48-96 hours after online publication and is updated daily on week days.
Initial download of the metrics may take a while.