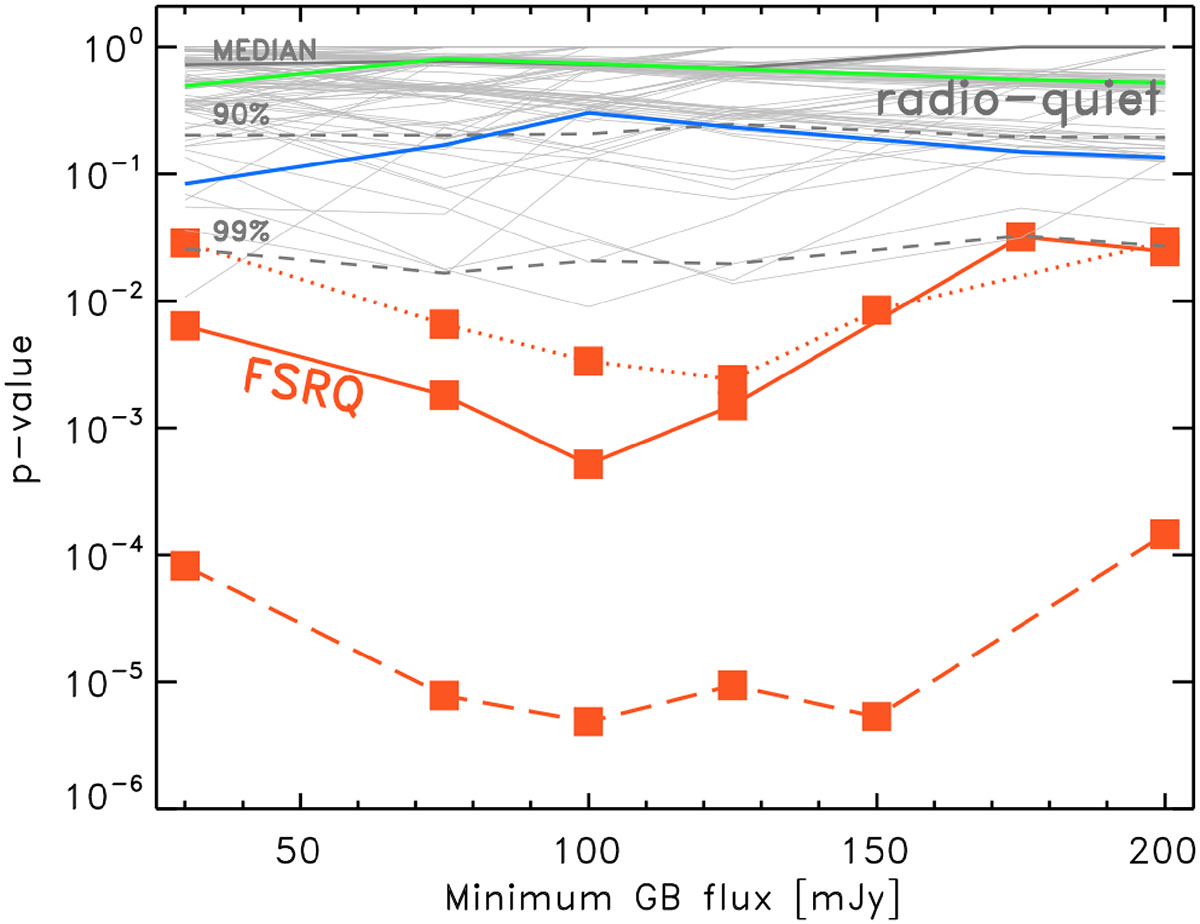
Fig. 4.
Download original image
p-values for the neutrino–CLASH associations (red) and neutrino–S11-RQ quasar associations (grey). The solid red line, plotted for different flux density limits, represents the probability of randomly finding an equal or greater number of neutrino events with at least one CLASH FSRQ within the error box. The dotted and dashed lines indicate the probabilities that the distribution of minimum distances between neutrinos and CLASH sources arises from a random distribution (KS test) for all 15 events and for the high-declination sample, respectively. The p-values for 100 RQ samples, of the same size as the FSRQ sample at the corresponding radio flux limit, are displayed in grey. The median value, along with the 90th and 99th percentiles, is calculated from 10 000 samples, which are not shown for clarity. We plot the p-values for the most luminous and most massive quasars of the S11 sample in green and blue, respectively.
Current usage metrics show cumulative count of Article Views (full-text article views including HTML views, PDF and ePub downloads, according to the available data) and Abstracts Views on Vision4Press platform.
Data correspond to usage on the plateform after 2015. The current usage metrics is available 48-96 hours after online publication and is updated daily on week days.
Initial download of the metrics may take a while.