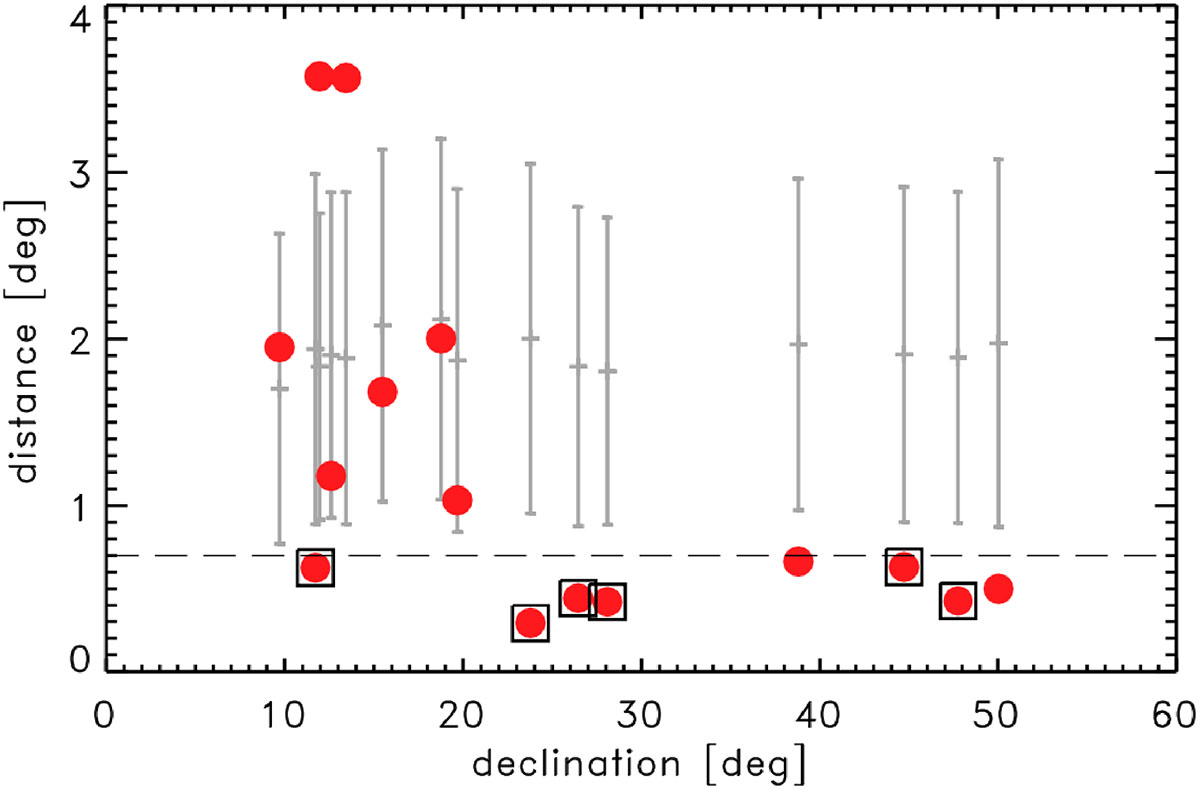
Fig. 5.
Download original image
Distances between the 15 neutrino events and the closest CLASH FSRQs as a function of the declination (red circles). A square around the circle indicates that the CLASH FSRQ is included in the nominal error region. For each event, in grey, we plot the mean and standard deviation of the distribution of the minimum distances of a quasar sample of the same size with randomized positions.
Current usage metrics show cumulative count of Article Views (full-text article views including HTML views, PDF and ePub downloads, according to the available data) and Abstracts Views on Vision4Press platform.
Data correspond to usage on the plateform after 2015. The current usage metrics is available 48-96 hours after online publication and is updated daily on week days.
Initial download of the metrics may take a while.