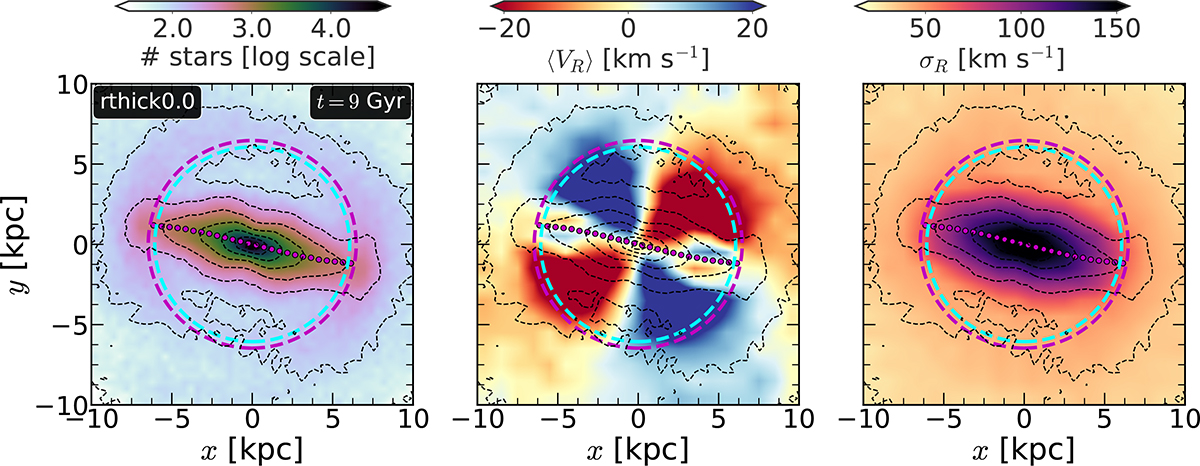
Fig. 1.
Download original image
Tracing the bar with the quadrupole feature: distribution of stellar surface density (left panel), mean radial velocity, ⟨VR⟩ (middle panel), and radial velocity dispersion, σR (right panel), calculated in the (x − y)-plane, for the rthick0.0 model, at the end of the simulation run (t = 9 Gyr). Dashed black lines denote the contours of constant surface density. The cyan dashed circle denotes the bar length, Rbar, and the magenta dashed circle denotes the extent of the quadrupole feature, Rquadrupole. The magenta points denote the spatial distribution of the phase-angle of the m = 4 Fourier moment (φ4). The bar excites a prominent quadrupole pattern in the mean radial velocity field, and the orientation of the quadrupole pattern agrees fairly accurately with the orientation of the bar. We used a galactocentric cylindrical coordinate system (R, ϕ, z) to calculate ⟨VR⟩ and σR.
Current usage metrics show cumulative count of Article Views (full-text article views including HTML views, PDF and ePub downloads, according to the available data) and Abstracts Views on Vision4Press platform.
Data correspond to usage on the plateform after 2015. The current usage metrics is available 48-96 hours after online publication and is updated daily on week days.
Initial download of the metrics may take a while.