Fig. A.1.
Download original image
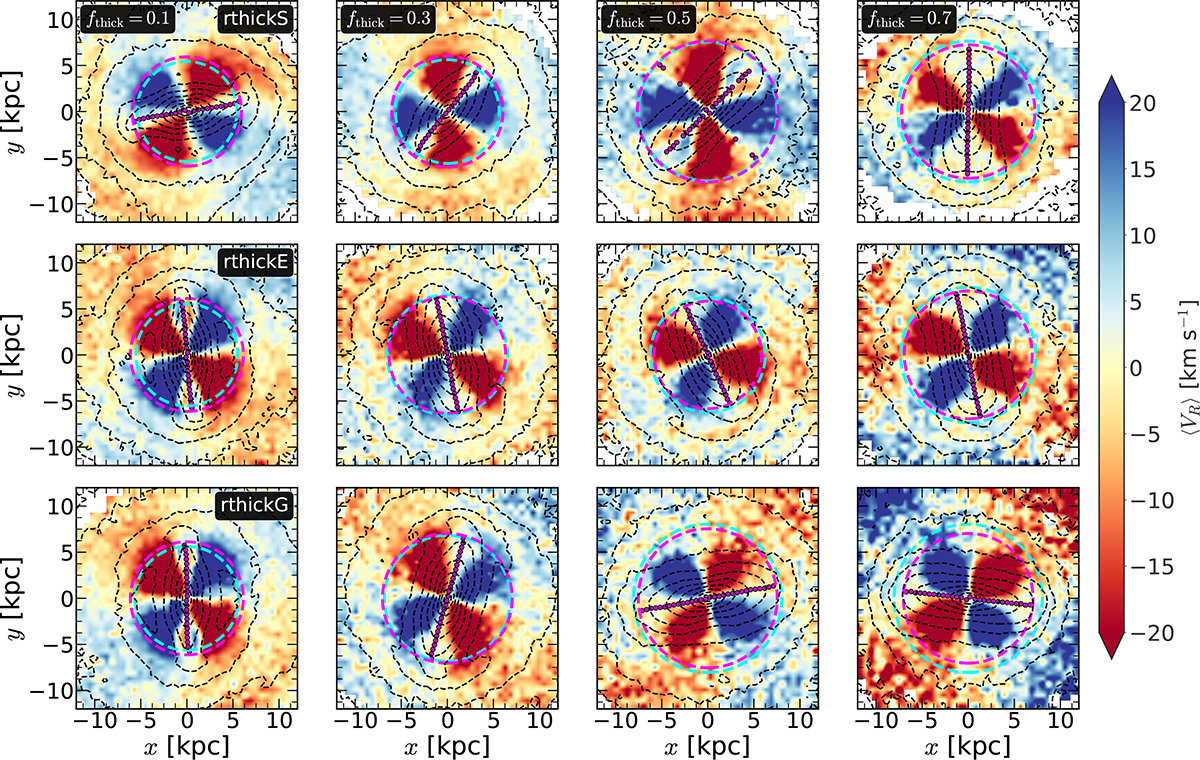
Distribution of the mean radial velocity, ⟨VR⟩ in the (x − y)-plane, calculated at the end of the simulation run (t = 9 Gyr), for all thin+thick models considered here. The dashed black lines denote the contours of constant surface density. The cyan dashed circle denotes the bar length, Rbar, and the magenta dashed circle denotes the extent of the quadrupole feature, Rquadrupole. The magenta points denote the spatial distribution of the phase-angle of the m = 4 Fourier moment (φ4). Top row: rthickS models. Middle and bottom rows: rthickE and rthickG models, respectively. The thick-disc mass fraction (fthick) varies from 0.1 to 0.7 (from left to right panels). A prominent quadrupole feature is present in all thin+thick models considered here.
Current usage metrics show cumulative count of Article Views (full-text article views including HTML views, PDF and ePub downloads, according to the available data) and Abstracts Views on Vision4Press platform.
Data correspond to usage on the plateform after 2015. The current usage metrics is available 48-96 hours after online publication and is updated daily on week days.
Initial download of the metrics may take a while.