Fig. 3.
Download original image
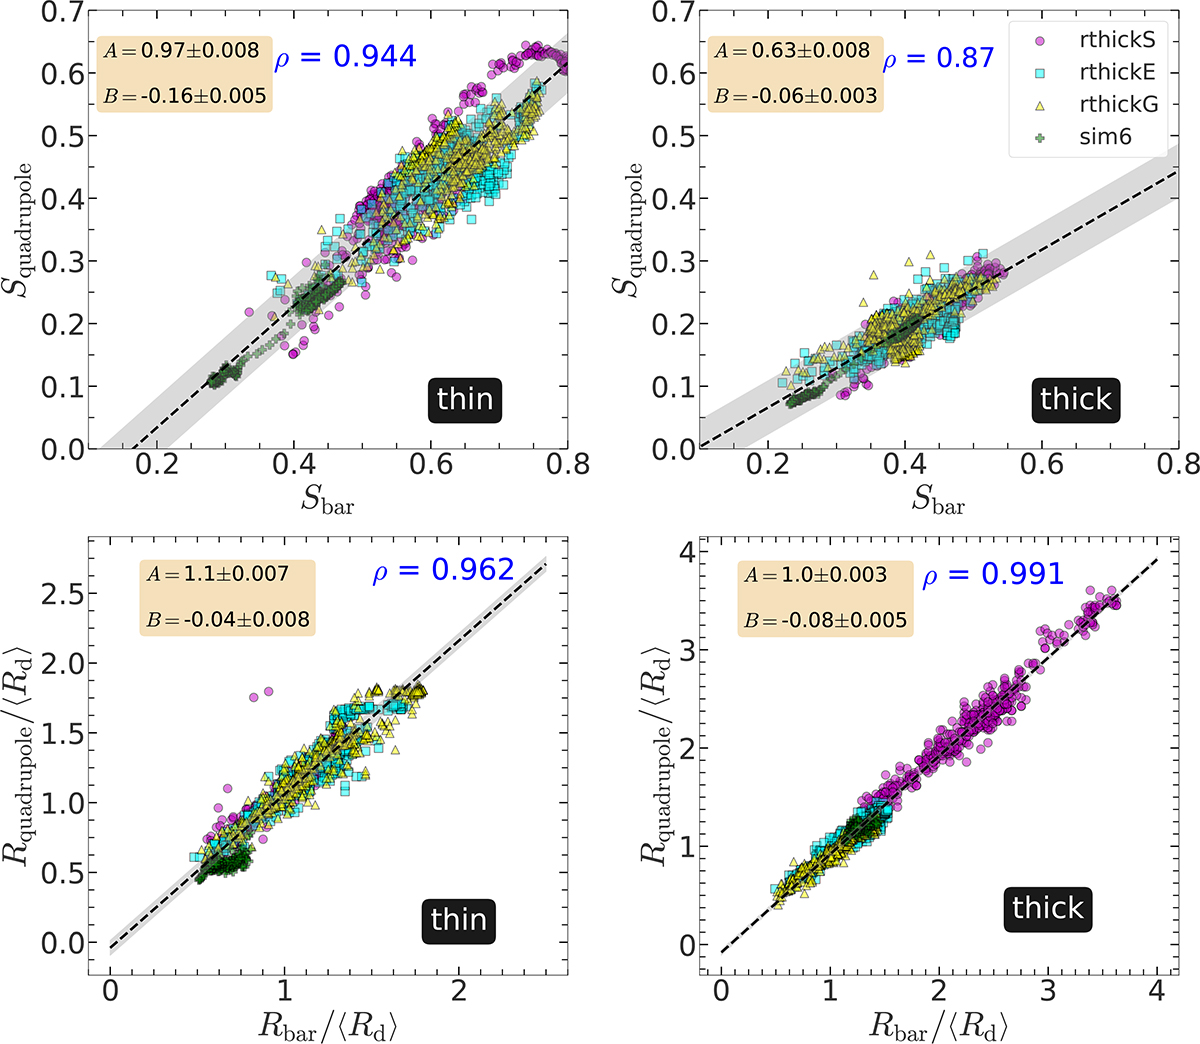
Dependence on the choice of the thin- or thick-disc stars: correlation between the bar strength, Sbar and the strength of the quadrupole, Squadrupole (top row), and correlation between the bar length, Rbar and the length of the quadrupole, Rquadrupole (bottom row), computed using thin-disc particles (left panels) and thick-disc particles (right panels), for all thin+thick models and the sim6 model (see the legend). The black dash line denotes the best-fit straight line (of the form Y = AX + B), while the grey shaded region denotes the 5-σ scatter around the best-fit line. Regardless of the choice of thin or thick-disc stellar particles, the length and strength of the quadrupole remain strongly correlated with the length and the strength of the bar.
Current usage metrics show cumulative count of Article Views (full-text article views including HTML views, PDF and ePub downloads, according to the available data) and Abstracts Views on Vision4Press platform.
Data correspond to usage on the plateform after 2015. The current usage metrics is available 48-96 hours after online publication and is updated daily on week days.
Initial download of the metrics may take a while.