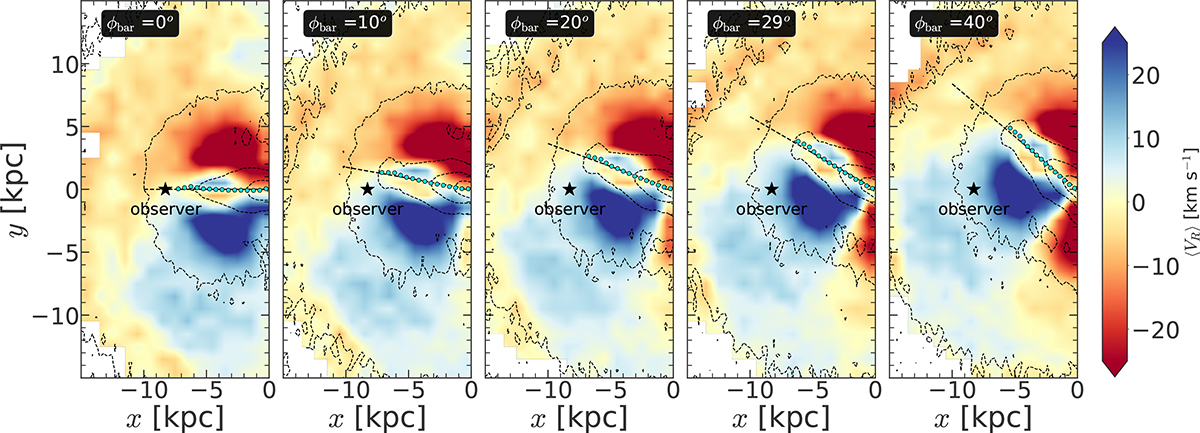
Fig. 4.
Download original image
Distribution of the mean radial velocity (⟨VR⟩) in the (x − y)-plane, calculated at t = 9 Gyr for the model rthick0.0, with the bar placed at different viewing angles with respect to a hypothetical observer (shown in diamond) at a solar-like position (R = −8 kpc, ϕ = 0°, z = 0). The cyan circles in each sub-panel denote the variation in the phase-angle of the m = 4 Fourier coefficient (φ4), computed from the distribution of ⟨VR⟩. The dashed straight line denotes the ‘true’ bar angle, computed from the intrinsic density distribution of the stellar particles.
Current usage metrics show cumulative count of Article Views (full-text article views including HTML views, PDF and ePub downloads, according to the available data) and Abstracts Views on Vision4Press platform.
Data correspond to usage on the plateform after 2015. The current usage metrics is available 48-96 hours after online publication and is updated daily on week days.
Initial download of the metrics may take a while.