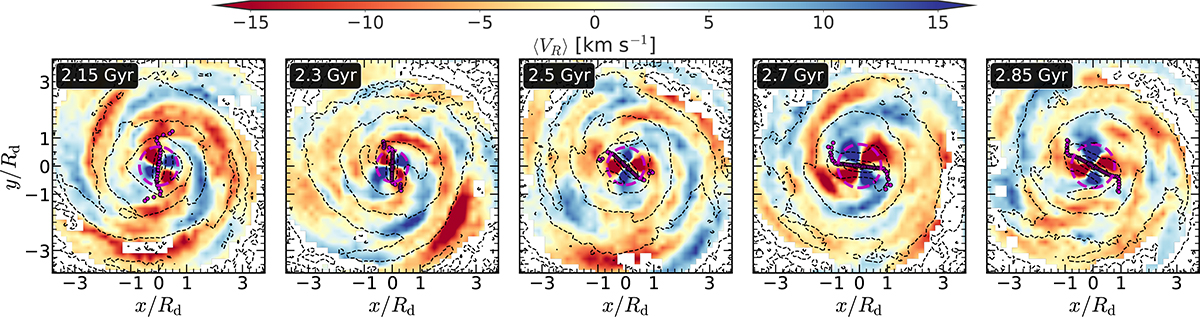
Fig. 6.
Download original image
Distribution of the mean radial velocity, ⟨VR⟩ in the (x − y)-plane, computed at different times when the model rthick0.0 harbours a strong bar and prominent spirals. Dashed black lines denote the contours of constant surface density. The magenta points denote the spatial distribution of the phase-angle of the m = 4 Fourier moment (φ4). Within the bar region, φ4 remains constant whereas in presence of prominent spirals, φ4 shows a characteristic modulation and this trend holds for all bar+spiral scenarios shown here.
Current usage metrics show cumulative count of Article Views (full-text article views including HTML views, PDF and ePub downloads, according to the available data) and Abstracts Views on Vision4Press platform.
Data correspond to usage on the plateform after 2015. The current usage metrics is available 48-96 hours after online publication and is updated daily on week days.
Initial download of the metrics may take a while.