Fig. 8.
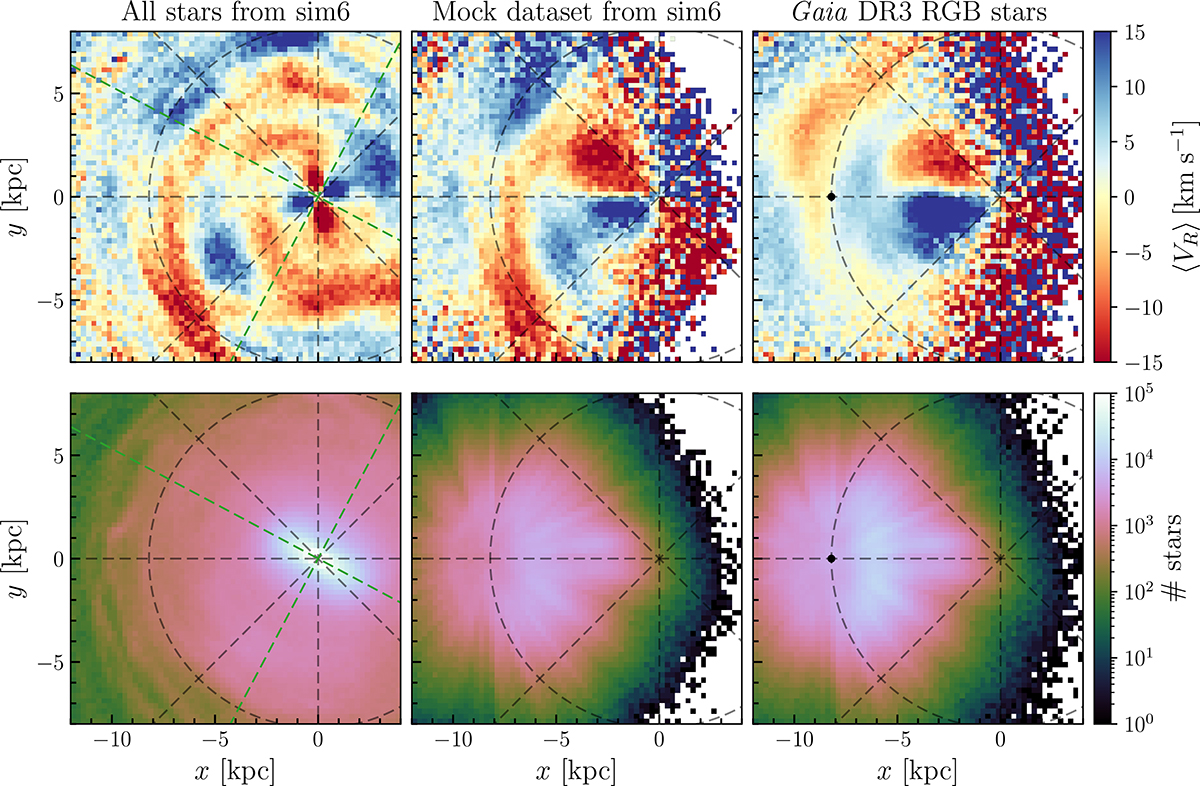
Download original image
Comparison between the Gaia-like mock data and the Gaia DR3 sample. Top panels: ⟨VR⟩ distribution and the bottom panels showing the stellar density, both in the (x − y)-plane, calculated for all the stellar particles from model sim6 (left column), the Gaia-like mock dataset from model sim6 (middle column) and the selected sample of RGB stars from the Gaia Data Release 3. As shown in this work, the mock dataset qualitatively reproduces the behaviour seen in the Gaia sample, notably, observational effects increase the extent of the quadrupole and reduce the angle of its main axis compared to y = 0. The green lines in the left column corresponds to the major and minor axis of the bar, angled at 28°. The black filled circle in the right column denotes the assumed solar location (for further details, see Sect. 4.1).
Current usage metrics show cumulative count of Article Views (full-text article views including HTML views, PDF and ePub downloads, according to the available data) and Abstracts Views on Vision4Press platform.
Data correspond to usage on the plateform after 2015. The current usage metrics is available 48-96 hours after online publication and is updated daily on week days.
Initial download of the metrics may take a while.