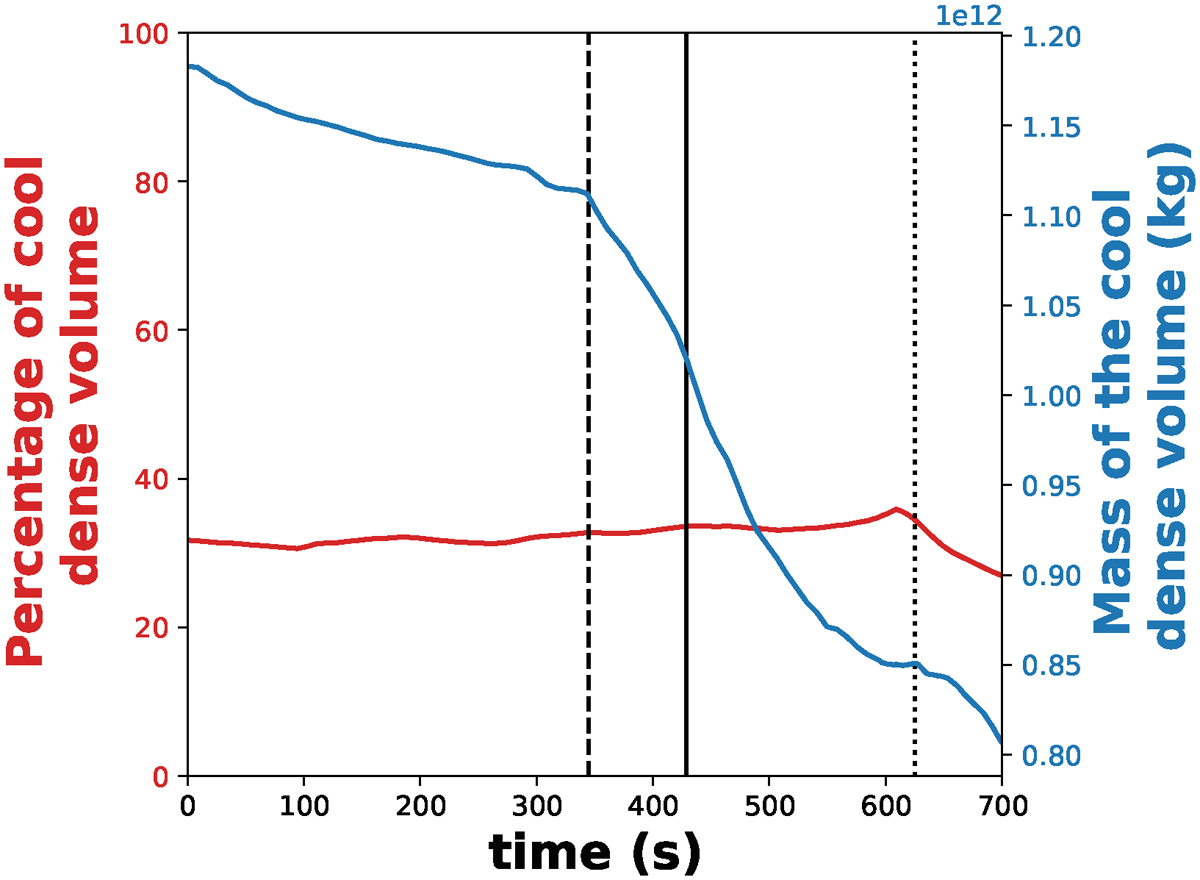
Fig. 2.
Download original image
Time evolution of the cool and dense solar prominence matter above the chromosphere boundary (above 2 Mm from the bottom boundary) taken below a threshold temperature of 5 × 10⁴ K, and denser than 10−11 kg m−3. The dashed line represents the phase of the initial decrease of mass of the cool and dense volume in the solar prominence due to the merging of the cool dense material into the chromosphere boundary. The dotted line represents the phase where the prominence material rises towards the top boundary with a significant loss of the prominence material. The solid line represents the evolution at time = 429.37 s (see Figure 1 (middle)).
Current usage metrics show cumulative count of Article Views (full-text article views including HTML views, PDF and ePub downloads, according to the available data) and Abstracts Views on Vision4Press platform.
Data correspond to usage on the plateform after 2015. The current usage metrics is available 48-96 hours after online publication and is updated daily on week days.
Initial download of the metrics may take a while.