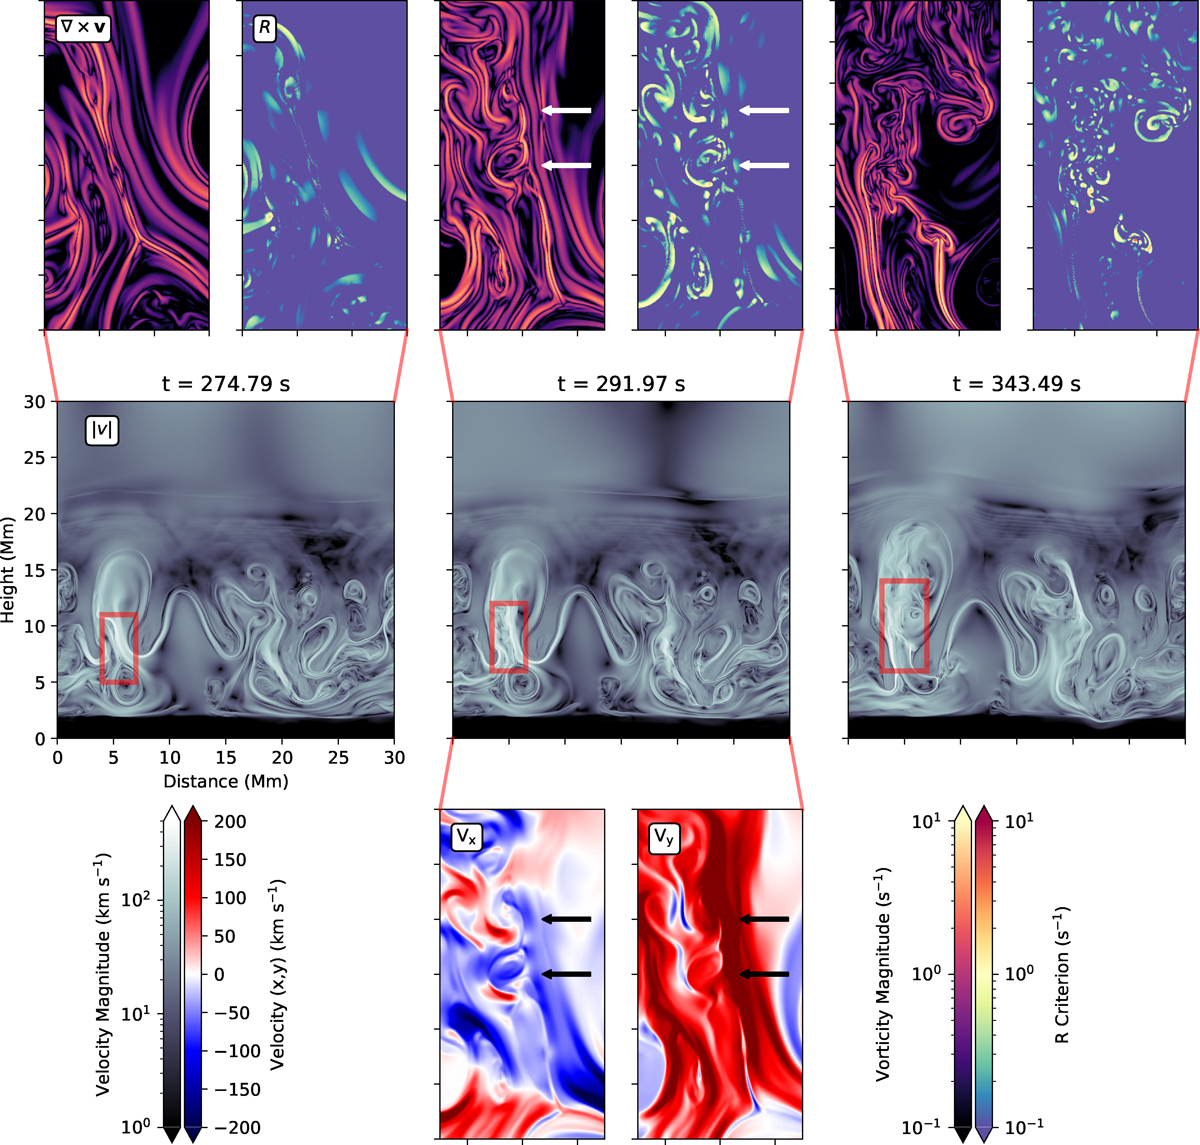
Fig. 3.
Download original image
Evolution of secondary KH instability in the prominence at time = 274.79, 291.97, and 343.49 s as shown in the red insets. The top row shows the zoomed image for the KH instability regions, represented as both vorticity ∇ × v and Rortex R, identified using the velocity magnitude in the middle row for each time. The bottom insets show the zoom region for time = 291.97 s, representing the vy and vx component of the velocity field at that time. Together, they signal a trail of (rising) vortex structures being formed.
Current usage metrics show cumulative count of Article Views (full-text article views including HTML views, PDF and ePub downloads, according to the available data) and Abstracts Views on Vision4Press platform.
Data correspond to usage on the plateform after 2015. The current usage metrics is available 48-96 hours after online publication and is updated daily on week days.
Initial download of the metrics may take a while.