Fig. 4.
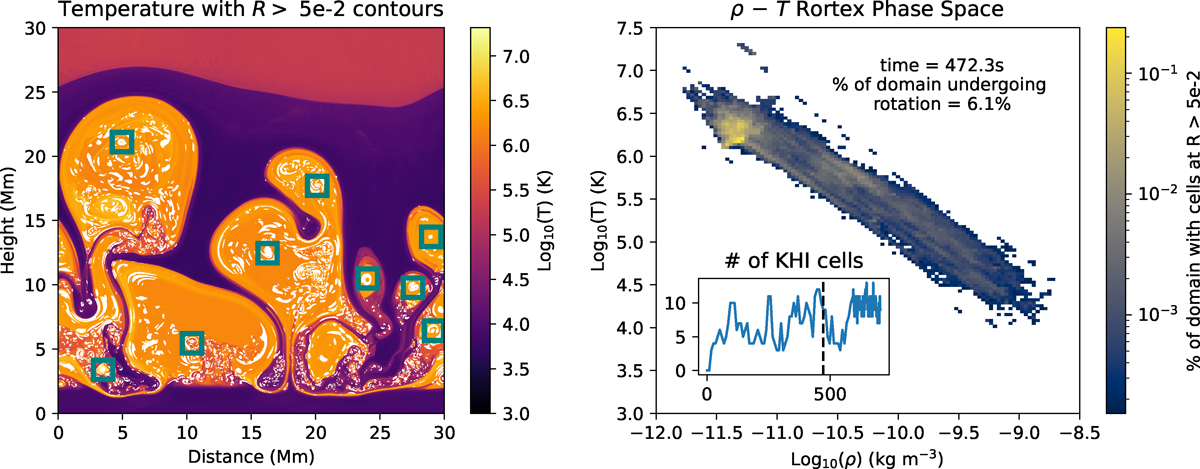
Download original image
Condition of the plasma undergoing rotational motion within the domain, as highlighted according to the R criterion. Left; the 2.5D domain of temperature with positions of R > 5 × 10⁻² s−1 and where λci > 10λcr overlaid in white, see text for description of these terms. A few clear KH instability cells have been indicated with teal boxes. Right; the density – temperature phase space of these extracted regions. A broad distribution is present, with a clear peak at the high temperatures and low densities of the solar corona. The inset axis plots the number of distinct KH cells in time (s), current time indicated by the dashed-black line, explanation in the text. An animation of this Figure will be available online.
Current usage metrics show cumulative count of Article Views (full-text article views including HTML views, PDF and ePub downloads, according to the available data) and Abstracts Views on Vision4Press platform.
Data correspond to usage on the plateform after 2015. The current usage metrics is available 48-96 hours after online publication and is updated daily on week days.
Initial download of the metrics may take a while.