Fig. 5.
Download original image
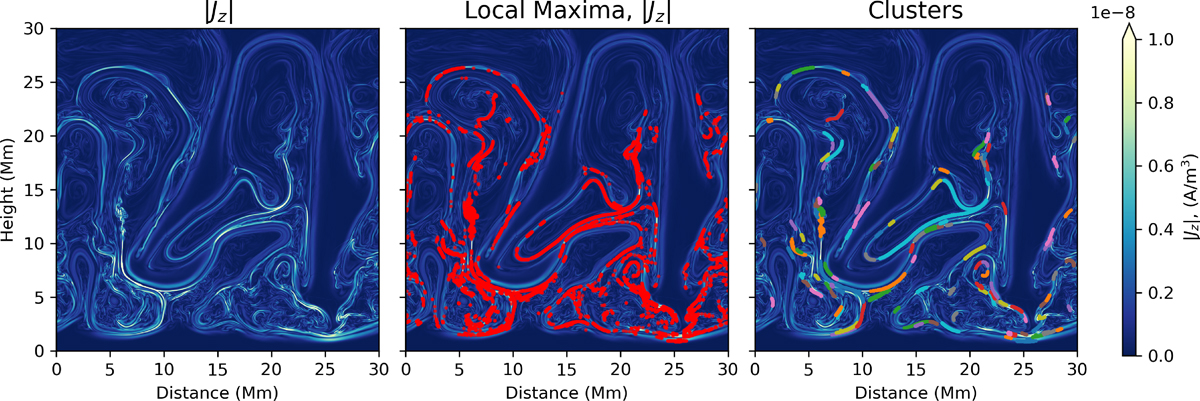
Detection of current sheets using the modified algorithm based on current density Jz at time 680.12 s. The left plot shows the current density magnitude, the middle plot shows the correspondence of local maxima events using a threshold higher than the mean |Jz| with the current density (|Jz|), and the right plot shows the identification of clusters derived from density clustering methodology using local maxima events at time 680.12 s. 123 separate clusters could be identified.
Current usage metrics show cumulative count of Article Views (full-text article views including HTML views, PDF and ePub downloads, according to the available data) and Abstracts Views on Vision4Press platform.
Data correspond to usage on the plateform after 2015. The current usage metrics is available 48-96 hours after online publication and is updated daily on week days.
Initial download of the metrics may take a while.