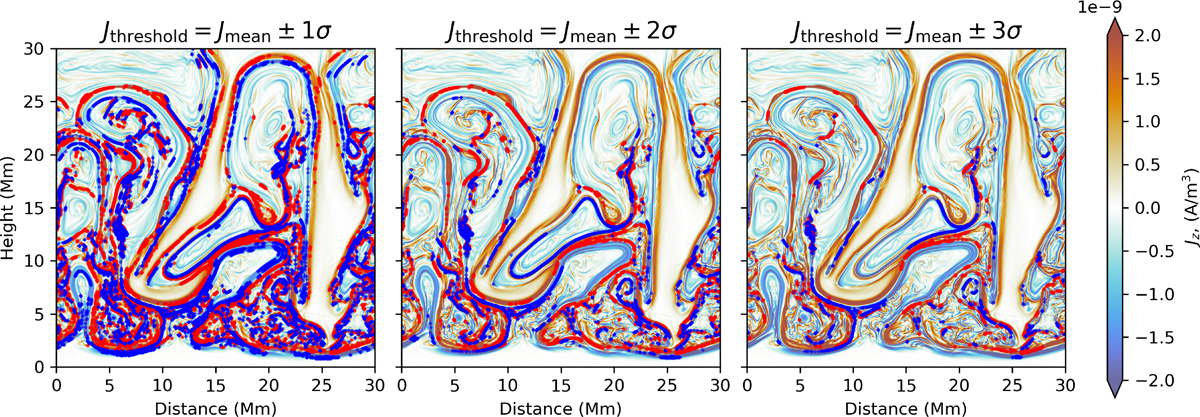
Fig. 6.
Download original image
Comparison of different threshold parameters of Jthreshold at time 680.12 s in correlating the local maxima events with the current density (|Jz|). The red current sheets represent the positive current sheets whereas the blue represent the negative ones. Depending on the threshold used, the algorithm may overlook significant current sheet regions to fulfil the parameter (right) or overfill the local maxima regions (left).
Current usage metrics show cumulative count of Article Views (full-text article views including HTML views, PDF and ePub downloads, according to the available data) and Abstracts Views on Vision4Press platform.
Data correspond to usage on the plateform after 2015. The current usage metrics is available 48-96 hours after online publication and is updated daily on week days.
Initial download of the metrics may take a while.