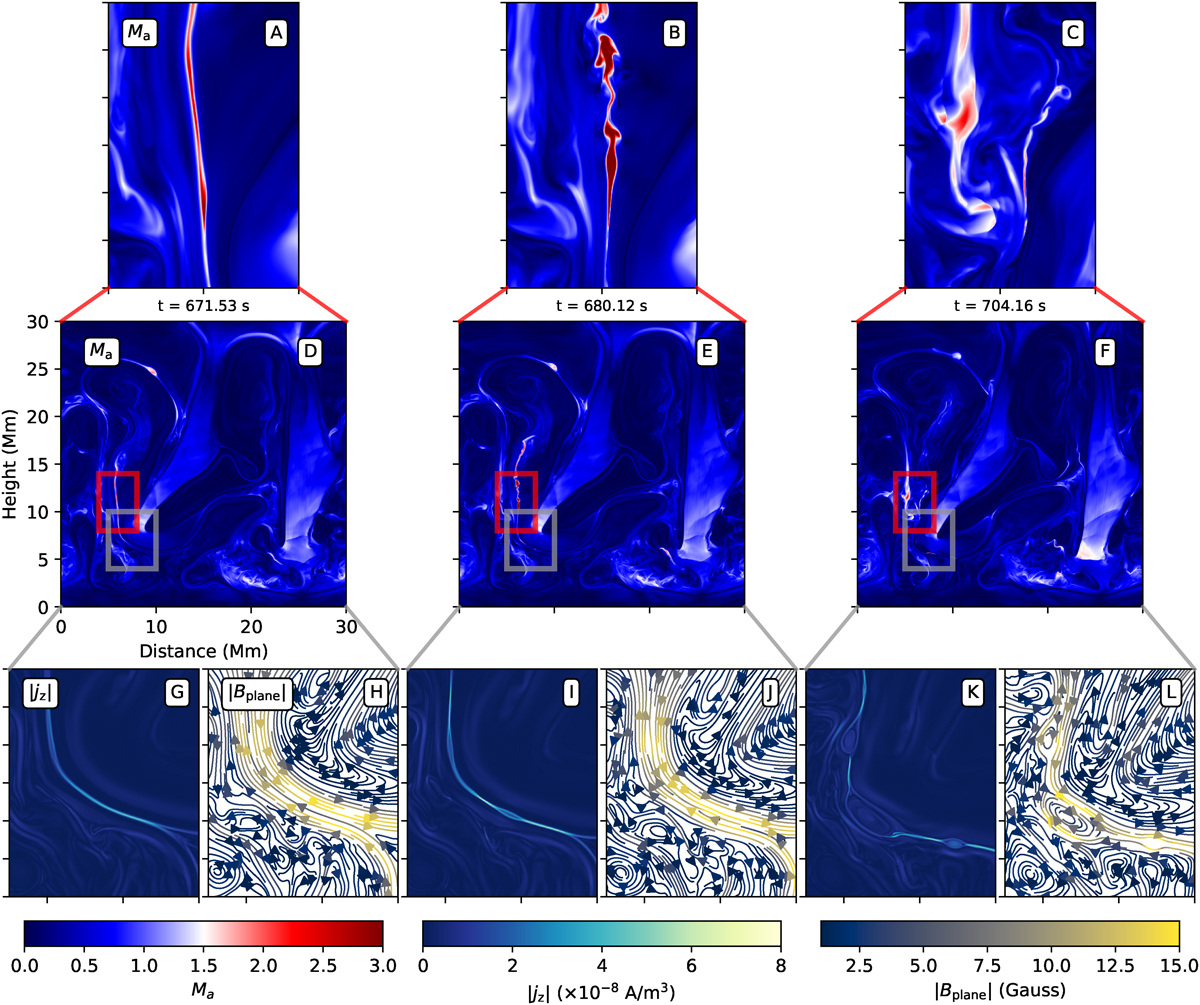
Fig. 8.
Download original image
Time series of the occurrence of jets in the prominence identified by regions where MA > 1 at time = 671.53, 680.12, and 704.16 s. Panels (A–C) show the zoomed images of Panels (D–F) and the occurrence of jets, here essentially flowing upwards. Panels (G–L) show the time evolution of current density (|Jz|) and magnetic field (|Bplane|) for zoomed regions where the jets emerge. Both the current sheets and subsequent magnetic islands responsible for the jets are clearly visible.
Current usage metrics show cumulative count of Article Views (full-text article views including HTML views, PDF and ePub downloads, according to the available data) and Abstracts Views on Vision4Press platform.
Data correspond to usage on the plateform after 2015. The current usage metrics is available 48-96 hours after online publication and is updated daily on week days.
Initial download of the metrics may take a while.