Fig. 1.
Download original image
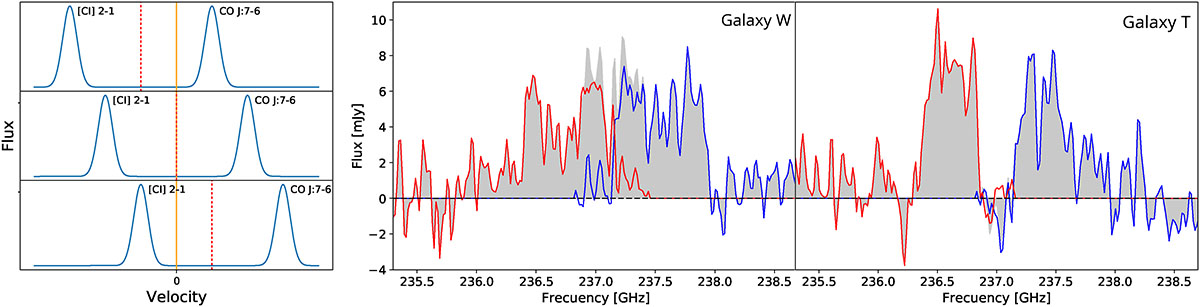
Left panel: illustration of the method used to separate the CO J:7–6 and [C I] 2–1 lines in individual channels of the datacube (see text). The dashed red line shows our choice for the dividing frequency (based on the fitted gas rotation model) and the solid yellow line shows the systemic velocity of the galaxy (see Sect. 4.1). Middle and right panels: Observed (filled grey regions) and rotation-model-separated profiles (see text) of the CO J:7–6 (red) and [C I] 2–1 (blue) emission lines in galaxy W (middle panel) and galaxy T (right panel).
Current usage metrics show cumulative count of Article Views (full-text article views including HTML views, PDF and ePub downloads, according to the available data) and Abstracts Views on Vision4Press platform.
Data correspond to usage on the plateform after 2015. The current usage metrics is available 48-96 hours after online publication and is updated daily on week days.
Initial download of the metrics may take a while.