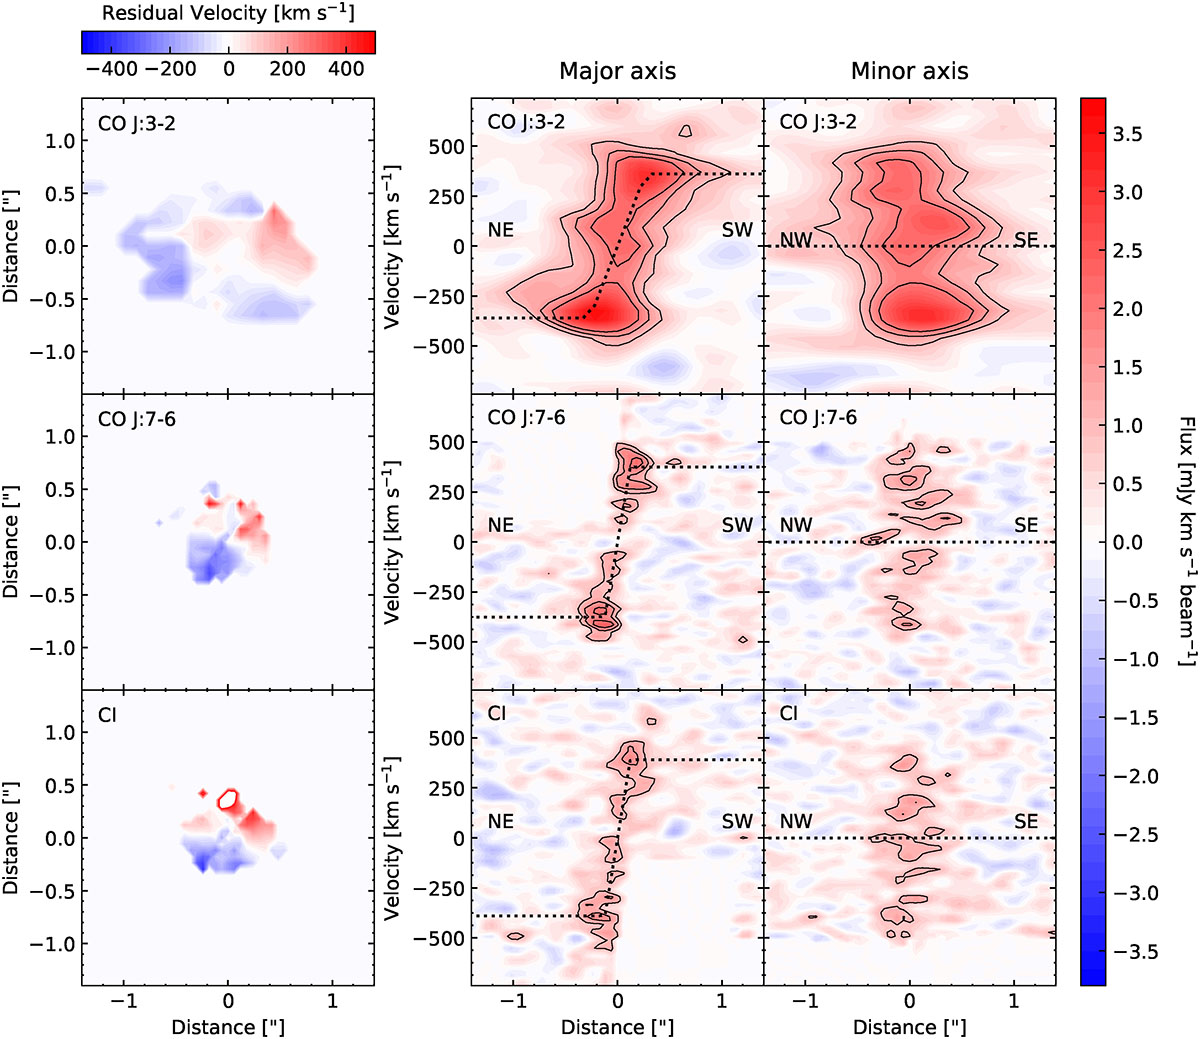
Fig. 10.
Download original image
Comparison of observed velocity fields to the Kinemetry-derived rotation-only models (see Sect. 3.2) for galaxy W. Top row: velocity field residuals (observed velocity minus our rotation-only model), and the position–velocity diagrams along the major (middle) and minor (right) axes of W, for the CO J:3–2 line. In the middle and right panels, emission line fluxes are shown in colour following the common colour bar to the far right and in black contours (1, 1.5 and 2 mJy km s−1 beam−1). The dashed black lines in these panels show the predictions of our adopted rotation model (see Sect. 4.4). The middle and bottom rows show the equivalent plots for the CO J:7–6 and [C I] 2–1 lines, respectively. All three left panels follow the colour bar on the top of the left panels, and areas with low signal to noise in the moment 0 map are masked. All other panels follow the colour bar shown on the right of the figure. At our adopted distance for HATLAS J084933, 1″ corresponds to 8.25 kpc. Each observed velocity field was input to the Kinemetry package to determine the kinematic PA and inclination (see text): these independently derived values are similar for all lines except CO J:3–2. The pure rotation models were then constructed (by eye) using these values of PA and inclination together with a simple model of solid body rotation which changes to a flat rotation beyond a certain radius.
Current usage metrics show cumulative count of Article Views (full-text article views including HTML views, PDF and ePub downloads, according to the available data) and Abstracts Views on Vision4Press platform.
Data correspond to usage on the plateform after 2015. The current usage metrics is available 48-96 hours after online publication and is updated daily on week days.
Initial download of the metrics may take a while.