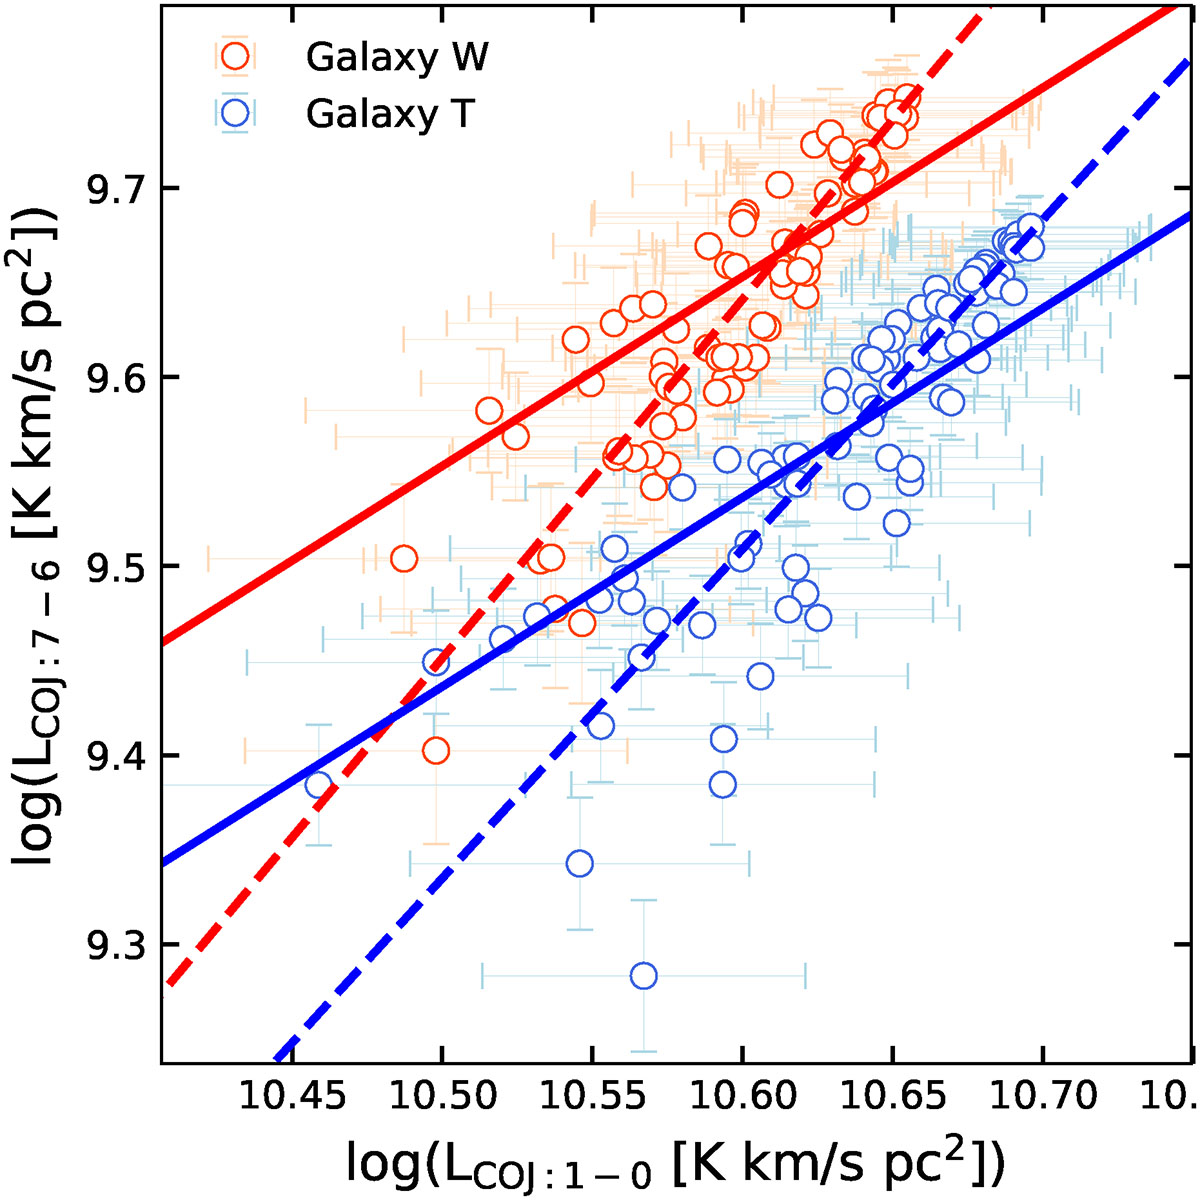
Fig. 13.
Download original image
Same as Fig. 8, but here we compare the emission line luminosities (L′line) of CO J:1–0 and CO J:7–6 for galaxies W and T, using kpc-scale apertures matched to the beam size of the line. The solid lines in the corresponding colour show the prediction if the galaxy integrated line flux ratio was valid over all individual apertures, and the dashed lines show the best linear fit to the datapoints.
Current usage metrics show cumulative count of Article Views (full-text article views including HTML views, PDF and ePub downloads, according to the available data) and Abstracts Views on Vision4Press platform.
Data correspond to usage on the plateform after 2015. The current usage metrics is available 48-96 hours after online publication and is updated daily on week days.
Initial download of the metrics may take a while.